
Fig. 3.
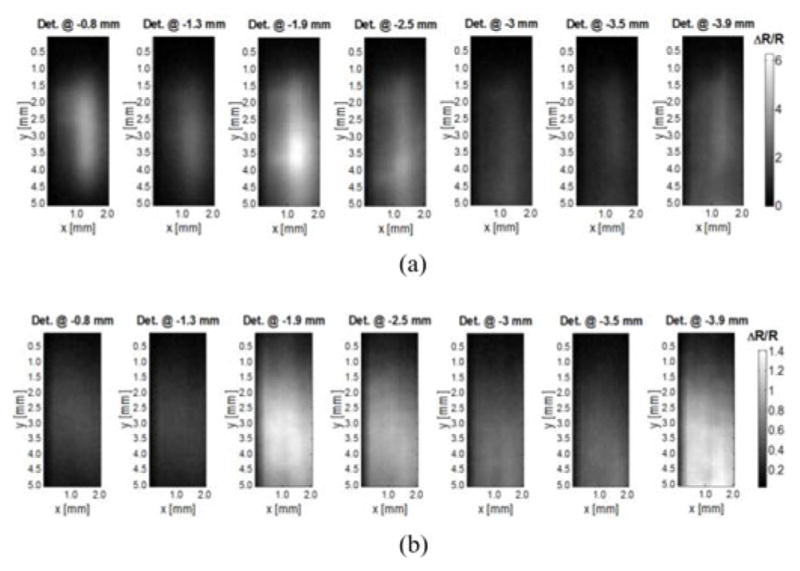
Synthetic measurements for the vascular model of Fig. 2. Each pixel corresponds to a source position for a specific detector offset with the vascular model embedded at depth of (a) 0.5 mm and of (b) 3 mm (SNR of 60). The colorbar represents the spatial contrast distribution acquired by each individual detector (ΔR) normalized to the overall dynamical range of measurements (R).