
Figure 2.
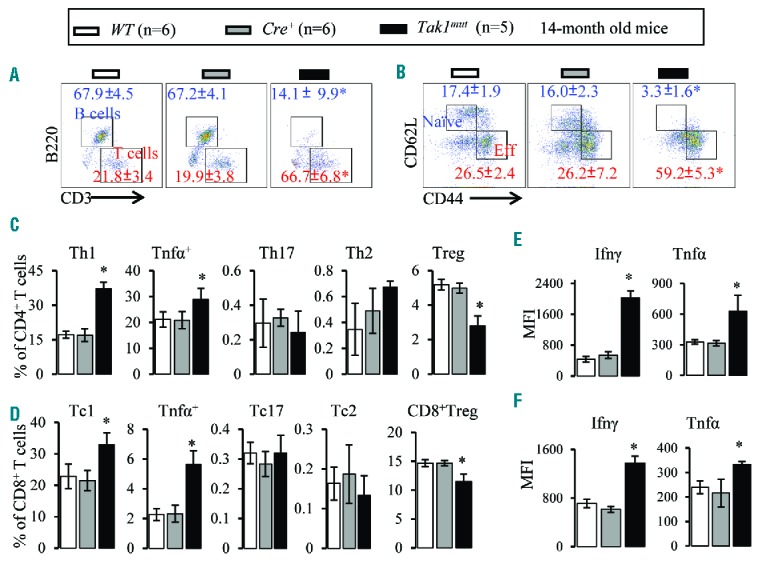
Increased activation of Th1 and Tc1 cells in Takmut mice. Bone marrow (BM) samples were collected from Tak1mut mice and their WT and Cre+ littermates at age 14 months. (A) Flow cytometric analysis of BM CD3+ T cells and B220+ B cells (gated on lymphocytes). (B) Flow cytometric analysis of naïve T cells (CD62L+ CD44−) and effector T cells (CD62LlowCD44hi) in BM (gated on CD3+ cells). (C) Percentages of Th1, Tnfa+, Th17, Th2, and Treg cells in BM (gated on CD4+ T cells). (D) Percentages of Tc1, Tnfa+, Tc17, Tc2, and Treg cells in BM (gated on CD8+ T cells). Ifnγ and Tnfα levels in BM CD4+ (E) and CD8+ (F) T cells were analyzed by mean fluorescence intensity (MFI) of intracellular antibody staining. Data are presented as means±SD. *P<0.05 compared to WT and Cre+ mice.