
Figure 7.
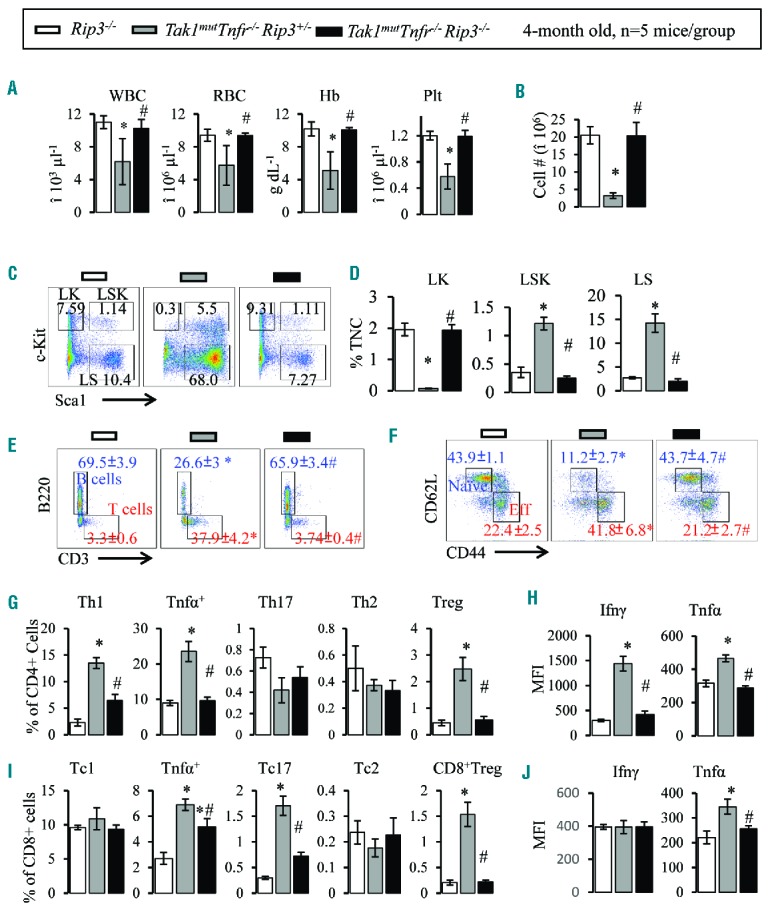
Rip3 knockout prevents BMF in Tak1mutTnfr−/− mice. Peripheral blood (PB) and bone marrow (BM) samples were collected from 4-month old Rip3−/−, Tak1mutTnfr−/−Rip3+/− and Tak1mutTnfr−/−Rip3−/− mice. (A) White blood cells (WBC), red blood cells (RBC), hemoglobin (Hb) and platelets (plt) were analyzed using the Hemavet 950 Hematology System. (B) Number of total nucleated cells (TNCs) in BM from two hind limbs were counted and compared. (C) Representative flow cytometric plots for analysis of BM hematopoietic stem cells (HSCs) and hematopoietic progenitor cells (HPCs). BM cells were first gated on the Lin− population and then analyzed for LK, LSK and LS populations. (D) Percentages of LK, LSK and LS populations in TNCs of BM. (E) Flow analysis of BM CD3+ T cells and B220+ B cells (gated on lymphocytes). (F) Flow cytometric analysis of naïve T cells (CD62L+ CD44−) and activated T cells (CD62LlowCD44hi) in BM (gated on CD3+ cells). (G) Percentages of Th1, Tnfα+, Th17, Th2, and Treg cells in BM (gated on CD4+ T cells). (I) Percentages of Tc1, Tnfa+, Tc17, Tc2, and Treg cells in BM (gated on CD8+ T cells). Ifnγ and Tnfα levels in BM CD4+ (H) and CD8+ (J) T cells were analyzed by mean fluorescence intensity (MFI) of intracellular antibody staining. Data are presented as means±SD. *P<0.05 compared to Rip3−/−; #P<0.05 compared to Tak1mutTnfr−/−Rip3+/−.