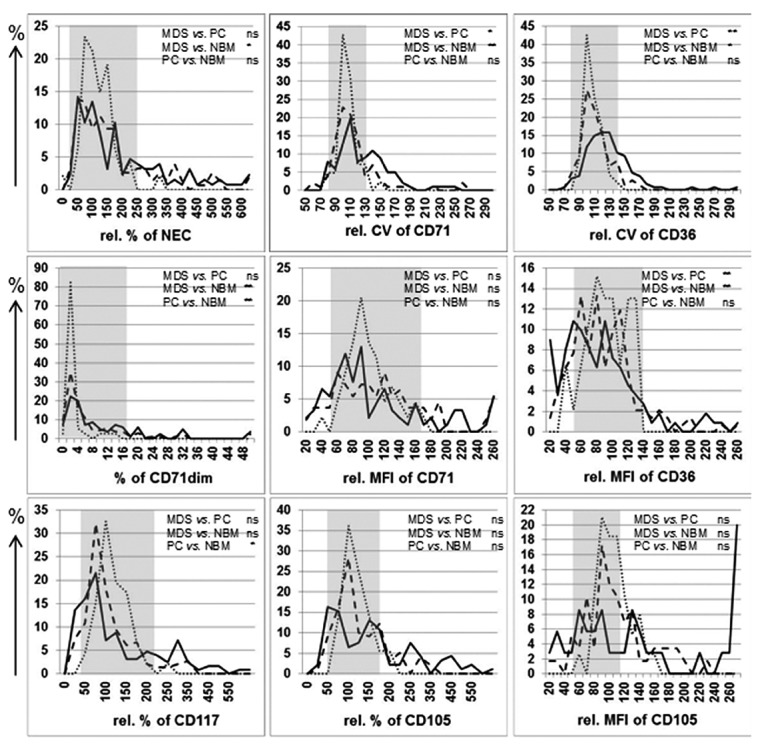
Figure 4.

Distribution of erythroid markers analyzed by FC within subgroups of MDS patients and controls within the validation cohort. Results of the analysis of selected markers of the erythroid lineage in the validation cohort are plotted along the X-axes: relative coefficient of variation (CV) of CD36 and CD71, and relative percentages of CD117+ erythroid progenitors. Normalization was performed against results for the normal bone marrow (NBM) samples of the validation cohort per each individual center. Relative frequencies are depicted along the Y-axes. Dotted lines represent results for NBM samples, dashed lines pathological controls (PC), and solid lines MDS cases. Grey boxes indicate 10th and/or 90th percentiles of pathological controls defined in the learning cohort that were applied for evaluating aberrancies.
