
Figure 1.
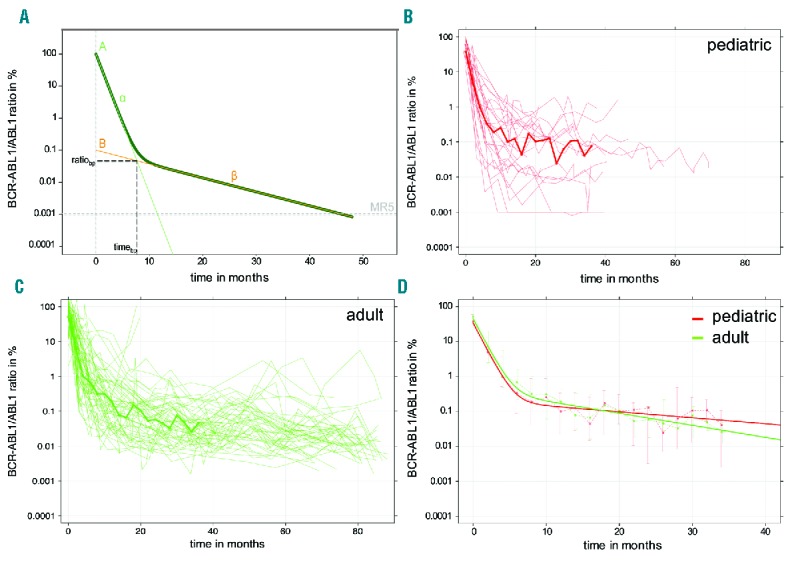
Individual and median time courses. (A) The statistical bi-exponential model describes the patient-specific treatment response by a ‘two slope dynamic’, in which the slope of the first decline is denoted as α and the slope of the second moderate decline as β. The breakpoint between first and second slope is characterized by its time of occurrence (timebp) and its corresponding BCR-ABL1/ABL1 level (ratiobp). (B and C) Individual time courses for all (B) pediatric (n=25) and (C) adult (n=55) patients. Solid lines indicate median values of all patients for whom BCR-ABL1/ABL1 ratios are available within 2-month intervals, (D) Comparison of the response kinetics using the bi-exponential regression model (solid lines), which is fitted to the median responses of the pediatric and adult patient cohorts. Whiskers indicate upper and lower quartiles.