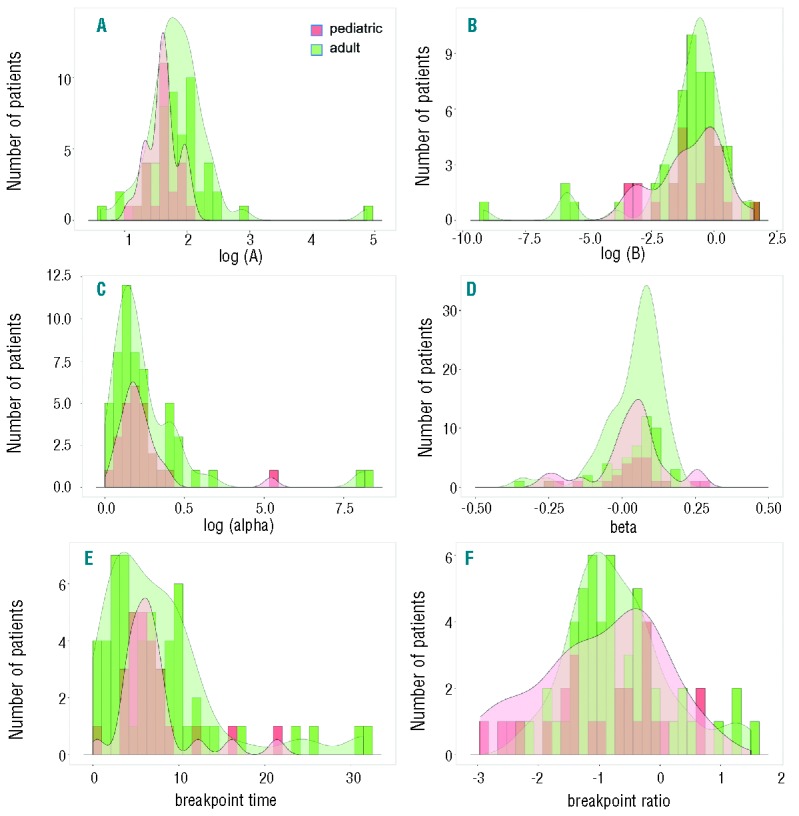
Figure 2.

Comparison of the individual parameters of the segmented regression model. Histograms (pediatric: red; adult: green) with overall density kernels (shaded) for the parameters of the statistical model: (A) intercept A [shown as log(A), Wilcoxon test P=0.007]; (B) intercept B [shown as log(B), P=0.950]; (C) slope α [shown as log(α), P=0.909]; (D) slope β (P=0.506); (E) time of breakpoint timebp in months (P=0.803); (F) level at breakpoint ratiobp (P=0.455).
