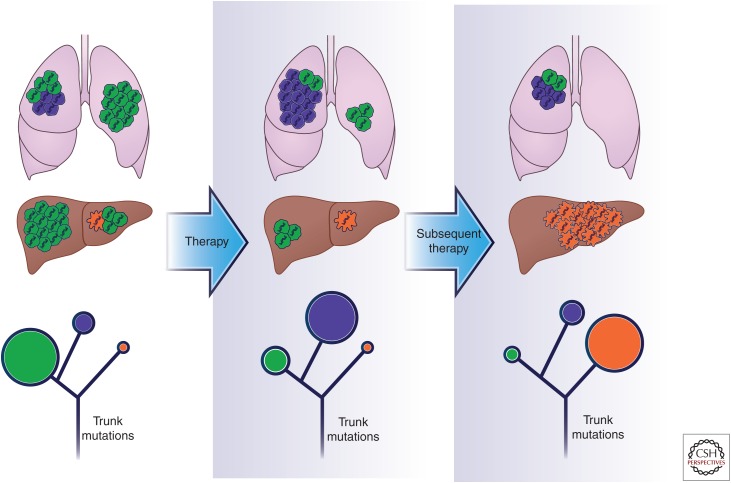
Figure 1.
Targeted therapies drive clonal evolution. The figure portrays clonal evolution of a human cancer during drug treatment. At diagnosis the tumor is composed of a dominant (green) clone and two low-frequency subclonal populations, indicated in purple and orange, present in two separate tumor lesions. Blue DNA strands in each cell are ubiquitous trunk alterations present in each tumor cell. Frontline therapy, chosen based on the predominant population identified at the diagnosis (green, in this case), induces tumor shrinkage and drives the outgrowth of a preexistent clone intrinsically resistant to treatment (purple). When secondary resistance arises, a subsequent line of treatment is chosen based on the predominant resistant population. In this case, a subclone (orange clone) gains fitness and rapidly grows, leading to treatment failure. In the lower part of the figure, phylogenetic trees of the patient’s tumor over the course of therapy are depicted. In each stage, circles indicate the tumor subclonal composition. Dimensions of the circles are proportional to the population present in each time point.

