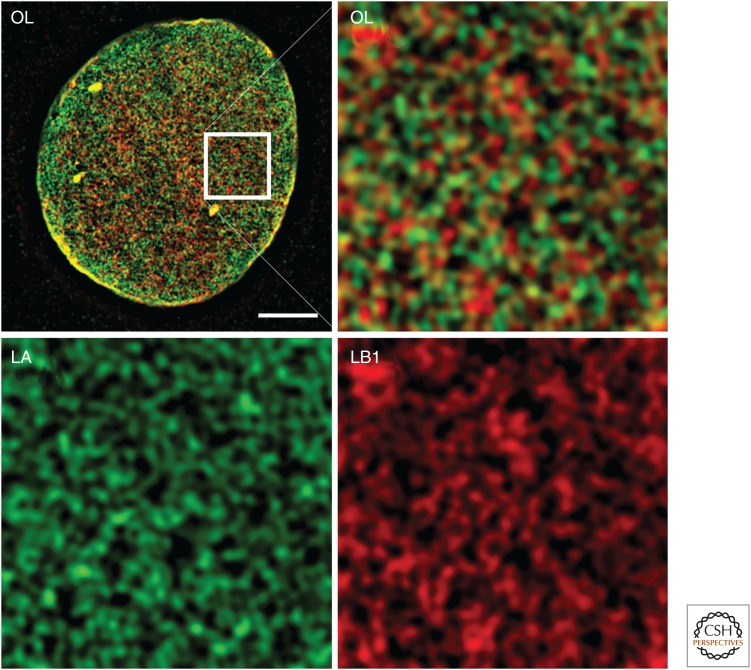
Figure 3.
Visualization of the lamin meshworks in the lamina of mouse embryo fibroblasts. Lamin A (LA) and lamin B1 (LB1) were detected by indirect immunofluorescence and visualized using three-dimensional structured illumination microscopy (Shimi et al. 2015). The LA and LB1 proteins form separate structures, seen by the lack of overlap between the red and blue colors. The upper left panel is an image of the bottom surface of a fibroblast nucleus. The white box is magnified in the image to the right, and the contribution of each lamin is shown in the lower two panels. Scale bar, 5 µm. OL, overlay.

