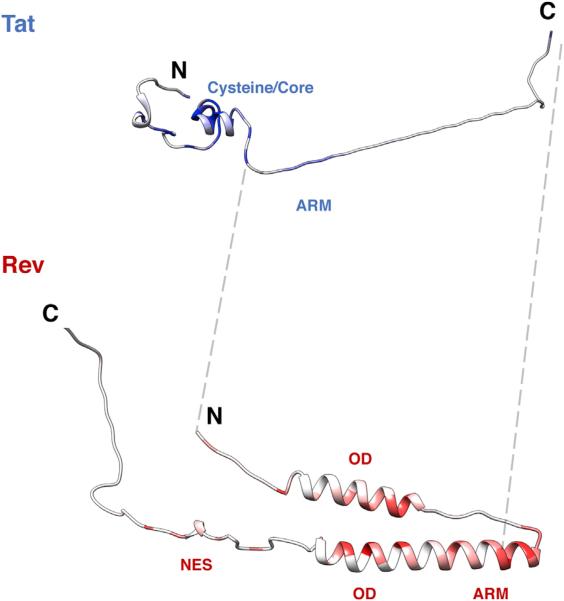
Figure 5. Structural Profiles of Tat and Rev.
Crystal structures of Tat (3MI9) and Rev (3LPH, 3NBZ) colored by median experimental fitness values. Dark blue/red coloring indicates strong selection for a particular amino acid at that site (white indicates median experimental fitness of 0). Unstructured regions in Tat (residues 50–86) and Rev (residues 1–9, 65–73, 86–116) were built in PyMOL and added to the structures for visualization purposes. The gray dashed lines flank the overlap in both proteins.
See also Figure S6.

