Figure 1.
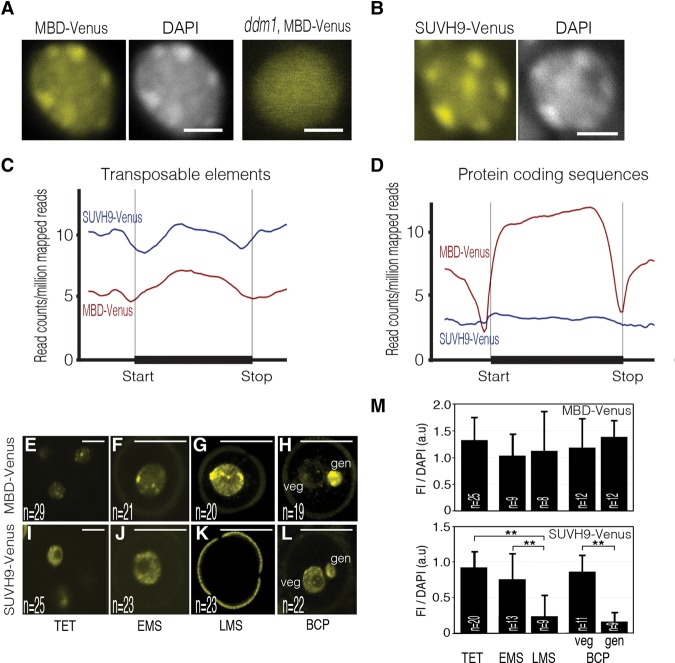
The DYNAMETs MBD-Venus and SUVH9-Venus are real-time reporters of DNA methylation status. (A,B) Representative nuclear distribution of MBD-Venus and SUVH9-Venus fluorescence in wild-type and ddm1 genetic backgrounds. Aggregate profiles of ChIP-seq (chromatin immunoprecipitation [ChIP] followed by sequencing) reads for MBD-Venus and SUVH9-Venus over transposable elements (C) and protein-coding sequences (D). Living-cell dynamic of MBD-Venus (E–H) and SUVH9-Venus (I–L) during male gametogenesis. Tetrads (TET) of haploid microspores (E,I), early microspores (EMS) (F,J), late microspores (LMS) (G,K), and bicellular pollen grains (BCP) (H,L) with a large vegetative cell and a smaller generative cell. Bars: A,B, 5 μm; E,I, 10 μm; F–H,J–L, 25 μm. Images are maximum intensity projections of Z-stacks. (M) Quantification of DYNAMET fluorescence intensity (FI) relative to DAPI during male gametogenesis. Cells were immunostained with an Atto 488-conjugated anti-GFP/YFP antibody. Error bars correspond to standard deviation. The number of nuclei analyzed (n) is indicated in each bar. (gen) Generative cell nucleus; (veg) vegetative cell nucleus. (**) P < 0.01. Only statistically significant pairwise differences are indicated.

