
Figure 2.
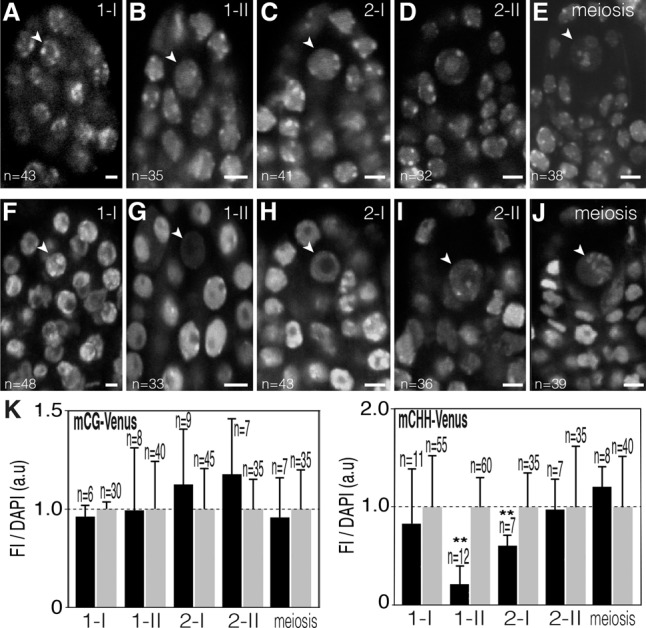
CHH methylation is reprogrammed during MMC differentiation. Representative confocal images of mCG-Venus (A–E) and mCHH-Venus (F–J) in living ovule primordia with differentiating MMCs (arrowhead) at stage 1-I (A,F), stage 1-II (B,G), stage 2-I (C,H), and stage 2-II (D,I) and with MMCs undergoing meiosis (E,J). Bars, 5 μm. (K) Ratio of DYNAMET fluorescence intensity (FI) relative to DAPI counterstain in developing MMCs (black bars) relative to the surrounding nucellar cells (gray bars). Flower buds were immunostained with an Atto 488-conjugated anti-GFP/YFP antibody. (a.u) Arbitrary units; (n) number of nuclei analyzed in each bar. Error bars correspond to standard deviation. (**) P < 0.01. Only statistically significant pairwise differences are indicated. Images are maximum intensity projection of Z-stacks.