Figure 3.

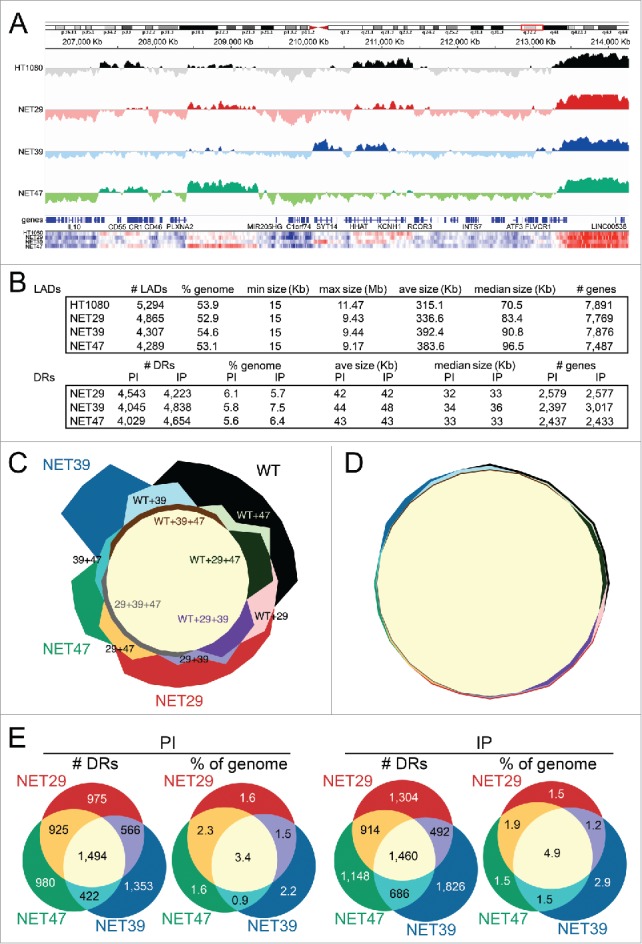
DamID maps of genes repositioned by NET expression in HT1080 fibroblasts. (A) The Log2(Lamin B1-Dam/ soluble Dam) values for the control untransfected and the stable lines expressing each of the 3 NETs are plotted against an 8 Mb region of Chromosome 1. Traces above the line indicate LADs. Bottom heatmaps plot the intensity of signal changes over the same region, using CBS-generated subregion sets (see materials and methods), revealing many additional subtle changes not easily visualized in the standard DamID traces. (B) Summary of LADs (top) and differential regions (DRs, bottom) between control HT1080 and HT1080 overexpressing one of 3 NETs indicating number of LADs/DRs, genome coverage, size range, average and median size, as well as number of genes overlapping those regions. DRs are classified as “IP” or “PI” which denote regions that become peripheral or lose peripheral association, respectively, upon overexpression of each NET. (C) Four-way proportional Chow Ruskey diagram comparing the number of LAD clusters and their intersects among HT1080 control (WT) and HT1080 cells overexpressing NET29, NET39 or NET47. The central pale yellow area corresponds to LAD clusters shared by all 4 conditions. A significant number of LAD clusters are specific for a single condition. (D) Four-way proportional Chow-Ruskey diagram comparing the genomic coverage of LAD clusters and their intersects among HT1080 control (WT) and HT1080 cells overexpressing NET29, NET39 or NET47. This panel is matched to and color-coded identically to panel C so that the small intersecting regions can be identified without labels. Although there are many LAD clusters unique to each condition, they represent a small proportion of the genome. (E) Three-way proportional Venn diagram comparing the number of differential regions (DRs) and genomic coverage (% of genome) changing with overexpression of each NET. PI (DRs moving away from the periphery) diagrams are shown on the left and IP (DRs moving toward the periphery) diagrams on the right.
