Figure 4.

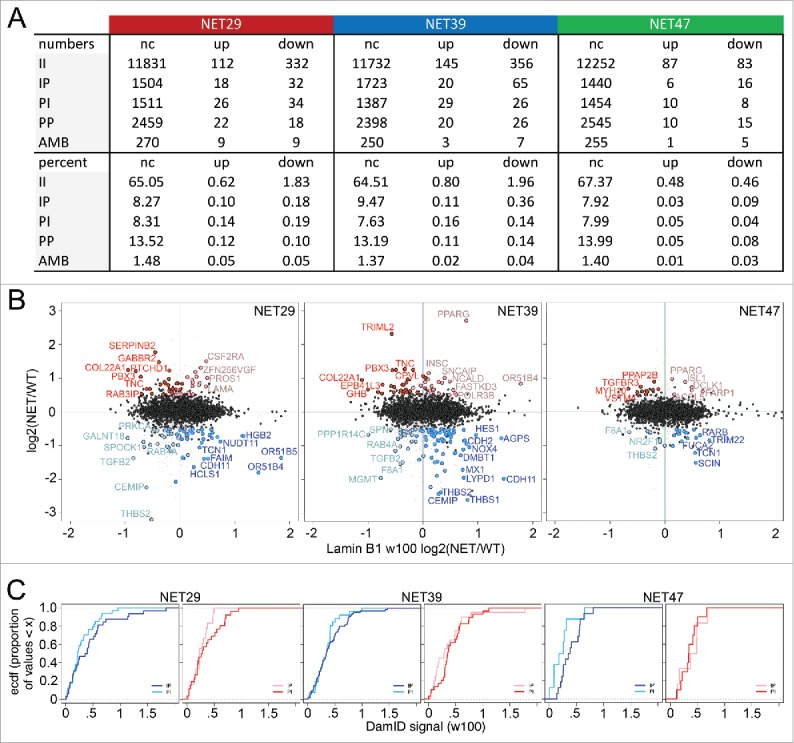
The relationship between NET-induced gene repositioning and expression. (A) Summary of intersect changes between DamID and microarray data. The DamID classes are described as II = stays internal, PP = stays peripheral, PI = shifts away from the periphery, IP = shifts toward the periphery, and AMB = ambiguous i.e., could not be determined. For gene expression data up and down designate upregulated and downregulated after overexpression of each NET, respectively, and ‘nc’ means ‘no change’. (B) Log2(Expression NET-HT1080/ expression control HT1080) gene expression changes are plotted against Log2(DamID NET-HT1080/ DamID control HT1080) of a 100 Kb window centered in each gene for the stable lines expressing each of the 3 NETs. For the colors, red is upregulation and blue is downregulation. The dark red spots correspond to upregulated PI genes and the pale red spots correspond to upregulated IP genes. Dark blue spots indicate downregulated IP genes while pale blue spots indicate downregulated PI genes. All gene expression values are mean average changes of triplicate microarray samples. Data available in Supplementary Table S2. (C) Empirical cumulative distribution frequency (ecdf) plots comparing IP and PI populations within the downregulated (left panel) and upregulated (right panel) genes for each NET. The colors are as in the previous panel: dark/pale blue lines represent downregulated IP/PI genes respectively, while dark/pale red lines represent upregulated PI/IP genes respectively. When a line rises earlier toward the plateau and stays to its left, it means that class of genes have overall a smaller laminB1-DamID signal change (in absolute value) between the control HT1080 cells and cells transfected with a particular NET. For all 3 NETs, the largest changes involved genes that were both downregulated and moved toward the periphery.
