
Figure 3.
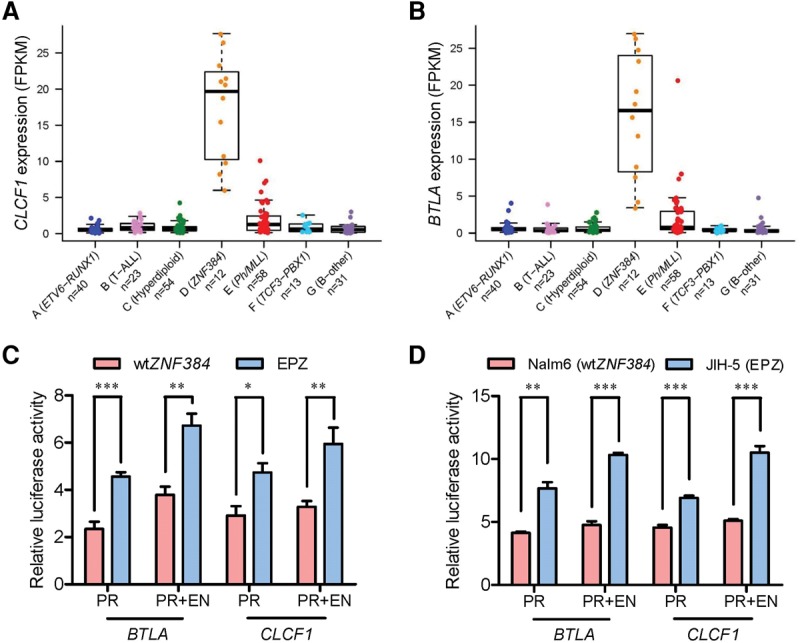
ZNF384 fusions transactivated CLCF1 and BTLA expression. (A,B) Expression of the CLCF1 (A) and BTLA (B) genes in seven ALL subgroups identified from hierarchical clustering. Each sample is represented by a dot and is color-coded according to the subgroups it belongs to. (C,D) Luciferase reporter gene assay of BTLA and CLCF1 promoter/enhancer activity. HEK293T cells were transiently transfected with pGL3 construct (luciferase gene with BTLA or CLCF1 promoter [PR] and/or enhancer [EN]), pcDNA construct (wild-type ZNF384 [wtZNF384] or EP300-ZNF384 [EPZ]), and pGL-TK (Renilla luciferase) (C). Similar sets of reporter gene assay were performed in the ALL cell lines Nalm6 (wtZNF384) and JIH-5 (EPZ) (D). Firefly luciferase activity was measured 24 h post-transfection and normalized to Renilla luciferase activity. Relative luciferase activity indicates the ratio over the value from pGL3 basic vector alone. All experiments were performed in triplicate and repeated at least three times. (PR) Promoter; (EN) enhancer; (wtZNF384) wild-type ZNF384; (EPZ) EP300-ZNF384 fusion. Statistical significance was evaluated by using two-sided Student's t-test: (*) P < 0.05; (**) P < 0.01; (***) P < 0.001.