Figure 4.

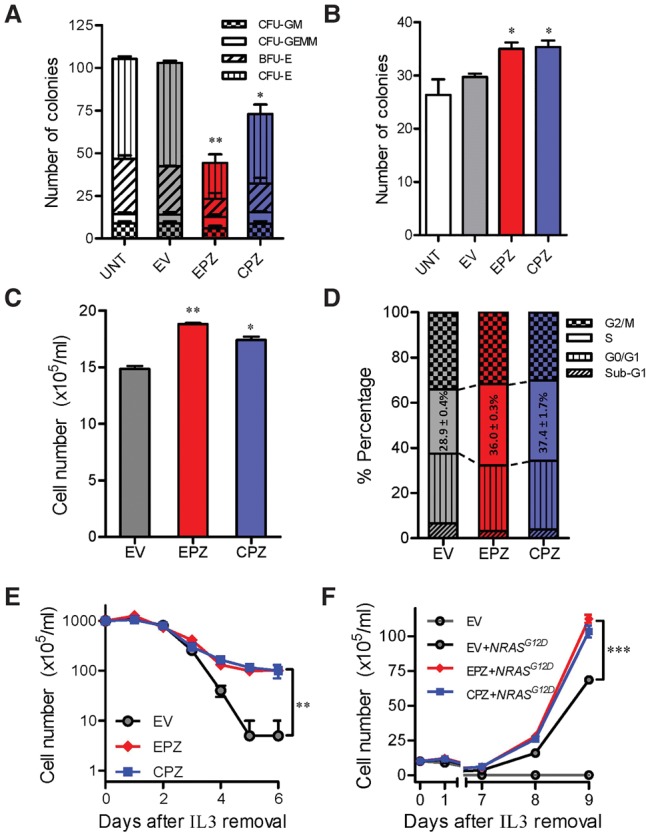
EP300- and CREBBP-ZNF384 fusions influence hematopoiesis and hematopoietic progenitor cell transformation in vitro. (A,B) Effects of fusion genes on mouse hematopoiesis in vitro. Mouse Lin−Sca1+c-Kit+ cells were lentivirally transduced with empty vector (gray), EP300-ZNF384 (red), or CREBBP-ZNF384 (blue). Cells were then cultured in methylcellulose medium supplemented with cytokines for myelopoisis (A) or pre-B-cell differentiation (B), and colony formation was assessed 12–14 d later. (C,D) ZNF384 fusion genes and proliferation of mouse hematopoietic progenitor cell Ba/f3. Ba/f3 cells were lentivirally transduced with empty vector (grey), EP300-ZNF384 (red), or CREBBP-ZNF384 (blue) and then cultured in the presence of IL3 (10 ng/mL). After 48 h, cell density was examined using Trypan blue (C), and cell cycle distribution was evaluated using a standard PI staining protocol (D). (E,F) Effects of fusion genes on Ba/f3 transformation. Following transduction of empty vector or ZNF384 fusion genes, Ba/f3 cells were cultured in IL3-depleted medium with cytokine-independent cell growth as a measure of oncogenic transformation. The number of viable cells was evaluated daily (E). A similar set of experiments was performed with cotransduction of oncogenic NRASG12D (F). All experiments were performed in triplicate and repeated twice. (EV) Empty vector; (EPZ) EP300-ZNF384 fusion; (CPZ) CREBBP-ZNF384 fusion; (CFU-GM) colony-forming unit–granulocyte, macrophage; (CFU-GEMM) colony-forming unit–granulocyte, erythrocyte, macrophage, megakaryocyte; (BFU-E) burst-forming unit–erythroid; (CFU-E) colony-forming unit–erythroid. Statistical significance of the differences between EPZ versus EV or between CPZ versus EV was estimated by using two-sided Student's t-test (A–C) or two-way ANOVA (E,F): (*) P < 0.05; (**) P < 0.01; (***) P < 0.001.
