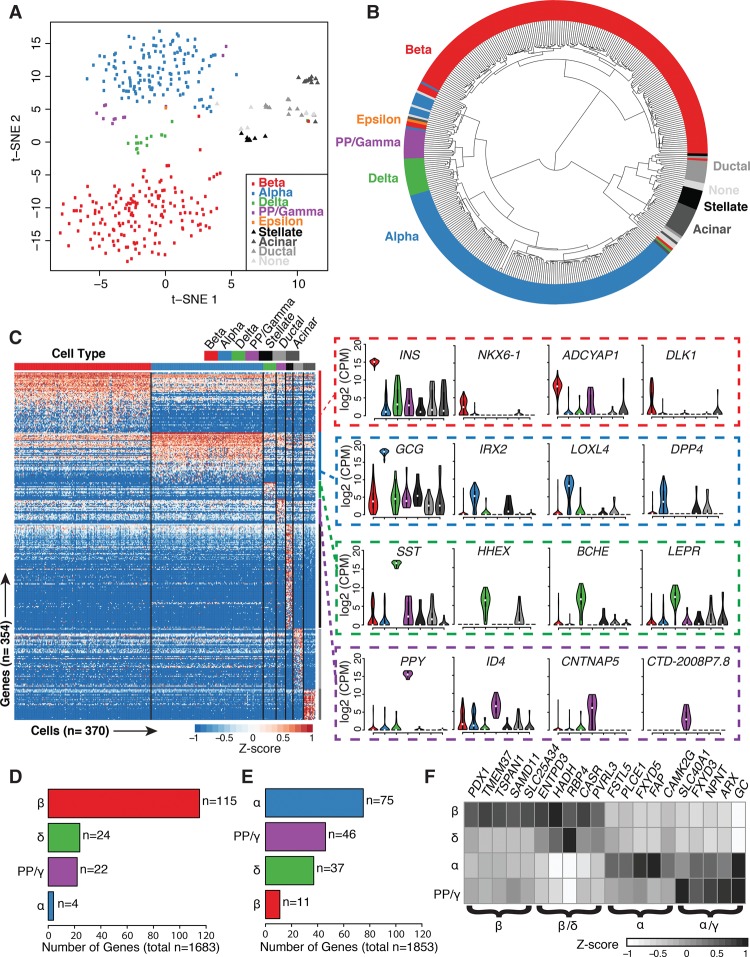
Figure 3.
Statistical analysis of nondiabetic single-cell transcriptomes identifies cell-type–specific clusters and defines the signature genes of each islet cell type. (A) Unsupervised analysis of single-cell transcriptomes using t-distributed stochastic neighbor embedding (t-SNE) demonstrates grouping of single islet cell transcriptomes into the major constituent cell types. Respective cell labels and coloring were added after unsupervised analyses. (B) Unsupervised hierarchical clustering illustrates relationships of transcriptome profiles between respective endocrine and exocrine cells. (C) Supervised differential expression analysis of cell types determines cell-specific (signature) genes across all cells (see Methods). Values represent log2(CPM) expression after mean-centering and scaling between −1 and 1. Violin plots of selected signature gene expression are displayed to the right of the heatmap. (D,E) Bar plots depicting the numbers of previously reported beta-specific (D) and alpha-specific (E) genes (Dorrell et al. 2011b; Bramswig et al. 2013; Nica et al. 2013; Blodgett et al. 2015) confirmed to be expressed in each islet cell type after ANOVA and Tukey's honest significant difference (THSD) post-hoc analysis (Methods). (F) Several beta-specific genes demonstrate similar expression levels in delta cells, and alpha-specific genes demonstrate similar expression in PP/gamma cells. Values represent average log2(CPM) expression after mean-centering and scaling between −1 and 1. (β) Beta; (α) alpha; (δ) delta; (γ) PP/gamma cells.

