Figure 4.
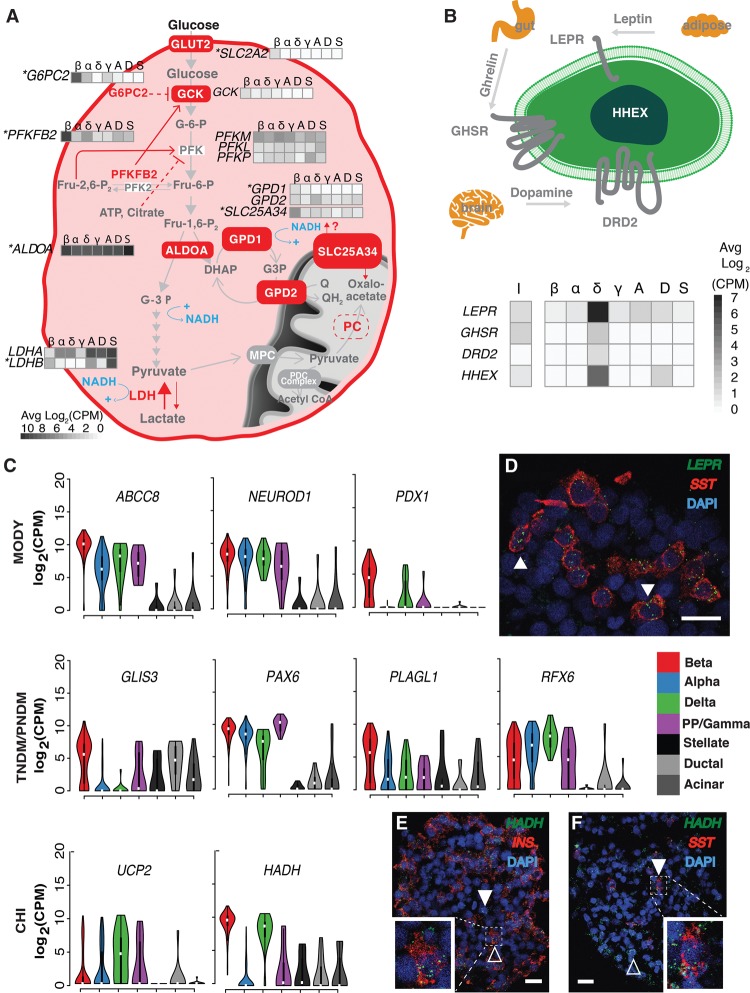
Cell-type–specific expression of metabolic, signaling, and diabetes trait genes. (A) Beta cell–specific expression of different isoforms of glycolytic and metabolic intermediate shuttles. Genes marked with an asterisk represent beta cell signature genes. (B) Delta cell–specific expression of neuroactive-ligand receptors and transcription factors. (I) Bulk intact islets; (β) beta; (α) alpha; (δ) delta; (γ) PP/gamma; (A) acinar; (D) ductal; (S) stellate cells. (C) Monogenic diabetes–associated genes and their cell-type–specific expression in islets. Violin plots show the log2(CPM) expression of each gene across cell types. (CHI) congenital hyperinsulinism; (MODY) maturity onset diabetes of the young; (TNDM) transient neonatal diabetes mellitus; (PNDM) permanent neonatal diabetes mellitus. (D) RNA in situ hybridization (ViewRNA, Affymetrix) of OCT-embedded islet sections from donor P3 labeling SST (red), LEPR (green), and nuclei (DAPI; blue). White arrowheads indicate SST+/LEPR+ cells. ViewRNA of OCT-embedded islet sections from donor P4 to detect the following: (E) INS (red), HADH (green), and nuclei (DAPI; blue) and (F) SST (red), HADH (green), and nuclei (DAPI; blue). White arrowheads highlight examples of HADH+/INS− (E) and HADH+/SST+ (F) cells. Hollow arrowheads highlight HADH+/INS+ (E) and HADH+/SST− (F) cells. In D–F, solid horizontal white lines indicate scale bars of 20 μm. In E and F, white dashed lines highlight a cell either co-expressing (E) INS/HADH or (F) SST/HADH. White squares in the bottom left of E and bottom right of F indicate magnified images of the cells highlighted in respective dashed white boxes.

