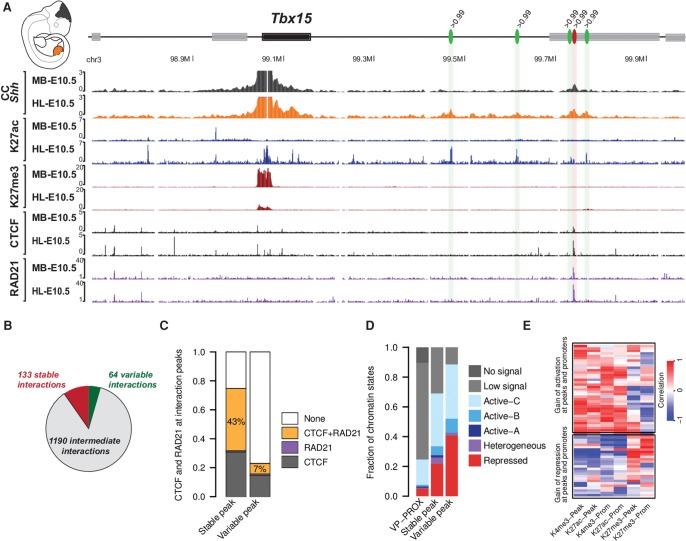
Figure 5.
Stable and variable interaction sites associate with CTCF/RAD21 and functional chromatin states, respectively. (A) At the Tbx15 locus, strong interaction peaks are formed with H3K27ac domains in early hindlimbs but are not present in the midbrain (green ovals), while another interaction seems stable and associates with CTCF/RAD21 (red oval). All the green peaks bear a signal strength >99th percentile in the hindlimb at E10.5; the red peak bears a signal strength >99th percentile in hindlimb and in midbrain at E10.5. (B) Number of stable, intermediate, and variable interactions. (C) Overlap of stable and variable interaction peaks with CTCF/RAD21 peaks. The percentage represents the fraction of cobinding CTCF/RAD21. (D) Distribution of chromatin states at stable and variable interaction peaks. (E) Heat map representing the Spearman correlation between interaction intensities at variable sites and corresponding H3K4me3, H3K27ac, H3K27me3 coverage at the linked promoter as well as the interaction site itself (see different columns).

