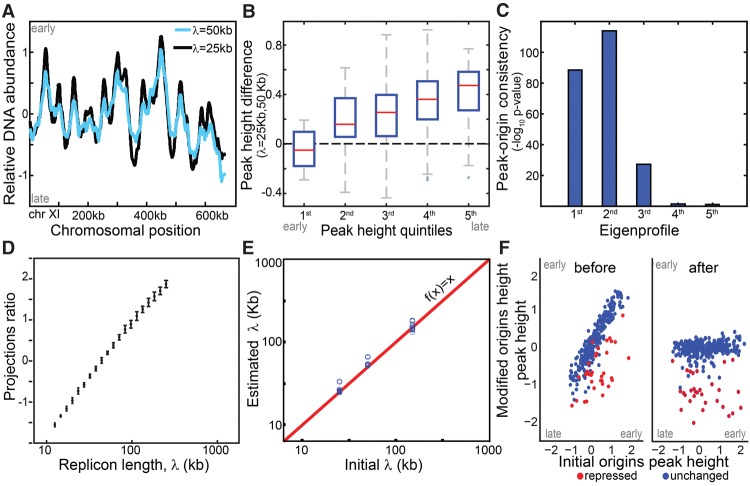
Figure 1.
Simulation wild-type and mutated replication profiles. (A) Replication profile is sensitive to replicon length: Shown are simulated profiles corresponding to replicon lengths of λ = 25 kb (black) and λ = 50 kb (light blue). High DNA abundance indicates early replicating regions, and peaks represent replication origins. (B) Late origins show increased sensitivity to replicon length: Origin activation time was approximated by DNA content at the origin position (peak height). The figure compares activation times of all origins based on a reference and a perturbed profile (λ = 50 and 25 kb, respectively) grouped to quintiles. (C,D) Replicon length is retrieved using singular value decomposition (SVD). Origins were accurately predicted by the two leading eigenprofiles defined by SVD analysis (Methods) (C). Each profile was projected into the two leading eigenprofiles. This projection ratio is tightly correlated with the (log) replicon lengths (D). (E,F) Predicting origin-specific effects. Mutants that perturbed both the replicon length and origin-specific efficiencies were simulated. Replicon length was retrieved when projecting the simulated profile on the two leading eigenprofiles (E). Normalizing the replication profiles for the predicted changes in replicon lengths highlights origin-specific effects (F).

