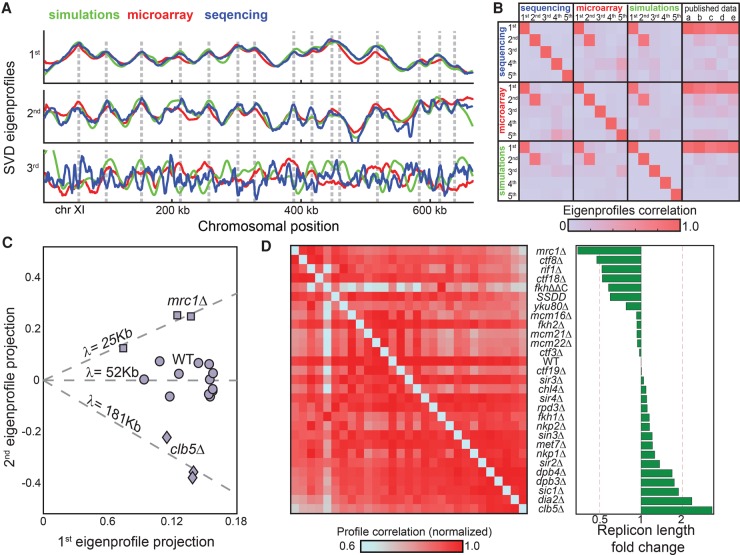
Figure 3.
S phase mutants differ in their replicon lengths. (A) SVD analysis of a compendium of budding yeast mutant profiles: The three leading eigenprofiles defined by SVD analysis of experimental and simulated data sets are shown (blue, red, and green; Chromosome XI). (B) Distinct data sets define the same two leading eigenprofiles. Shown are the correlations between the five leading eigenprofiles from each data set (simulations, microarray, and sequencing), and their correlations with previously published wild-type data: (a) Alvino et al. (2007); (b) Feng et al. (2006); (c) McCune et al. (2008); (d) Müller and Nieduszynski (2012); and (e) Raghuraman et al. (2001). (C) Predicted replicon lengths are consistent between replicates. The replication profiles of wild-type cells, cells deleted of CLB5, and cells deleted of MRC1 were measured with 12, four, and three replicates, respectively. Shown are the projections of each individual repeat on the two leading eigenprofiles. The (log) replicon length is predicted by the slope (projection ratio). (D) Predicted replicon lengths. Shown are the predicted replicon lengths for the mutants in our data set. The left panel shows the correlation between respective profiles. For each mutant, correlation values were normalized by their maximum to control for differences in noise levels.

