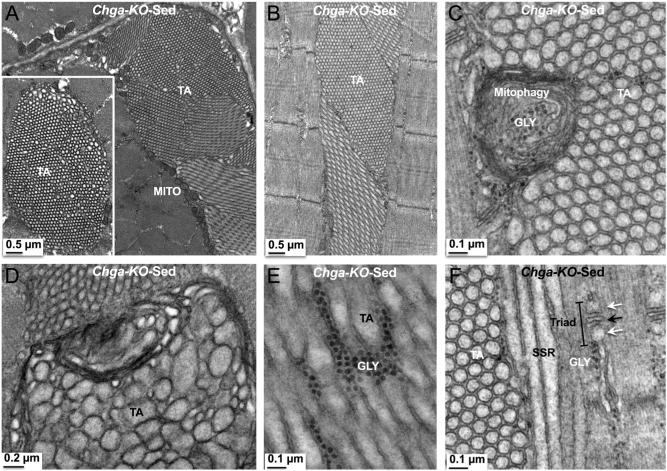
Figure 11.
Tubular aggregates (TAs) in sedentary Chga-KO GAS muscle. (A) Transverse section showing a large aggregate where sub-clusters display different tubule orientation relative to the sarcomere and mitochondria (MITO) in the outer border of TA. The inset shows a honeycomb-like TA. (B) Longitudinal section showing a TA, which runs parallel to the sarcomere. (C) Longitudinal section showing a TA with paracrystalline single-walled tubules of comparable area and a damaged mitochondrion (mitophagy). (D) Longitudinal section showing a TA, where paracrystalline tubules are of different areas. (E) Longitudinal section showing a TA with double-walled tubules and glycogen (GLY) granules in between two tubules. (F) Longitudinal section showing a TA where tubules are cut in the longitudinal, oblique or perpendicular to the sarcomere. Note triad and glycogen granules in the vicinity of TA. Black arrow points to T-tubule and white arrow points to smooth sarcoplasmic reticulum.

