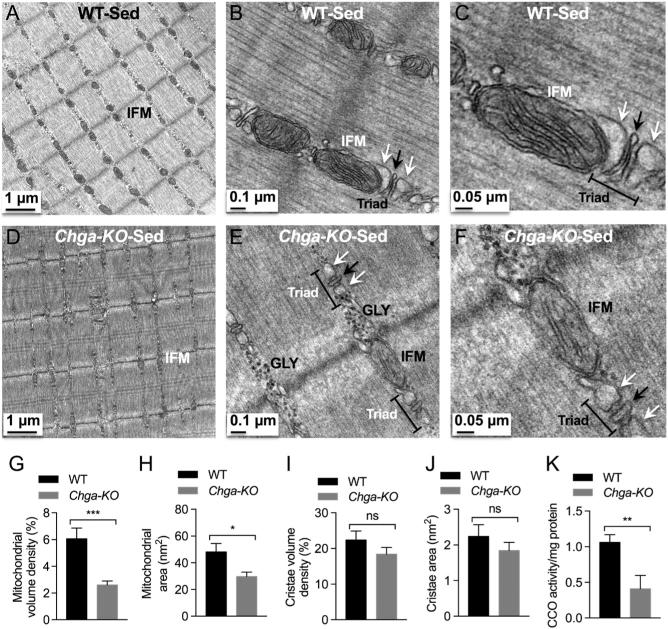
Figure 7.
TEM micrographs in GAS muscle of sedentary mice. Intermyofibrillar mitochondria (IFM) at magnification 2500× (A), 15,000× (B), and 30,000× in WT mice. Note the triad comprising of T-tubule (shown by black arrow) flanked by smooth sarcoplasmic reticulum (shown by white arrow). IMF mitochondria at magnification 2500× (D), 15,000× (E), and 30,000× (F) in Chga-KO mice. Note glycogen (GLY) granules either in one or both sides of the Z-disc and smaller triad in Chga-KO mice. Morphometric analyses (15 mitochondria from 15 sections per mouse for a total of 4 mice) of TEM micrographs from sedentary WT and Chga-KO mice. (G) Mitochondrial volume density (%). (H) Mitochondrial area (nm2). (I) Cristae volume density (%). (J) Cristae area (nm2). (K) Cytochrome C oxidase (CCO) activity in sedentary WT and Chga-KO mice.

