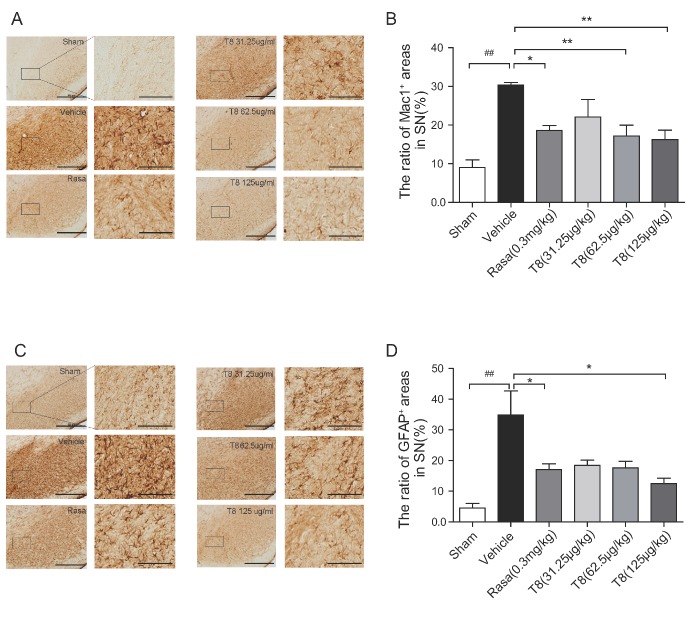
Figure 5.
The glial response in the PD rat model treated with LLDT8. The representative IHC staining for Mac1+ microglia (A) and GFAP+ astrocytes (C) in SNpc. Scale bar = 500 μm. The quantitative percentage of area occupied by Mac1+ cells (B) and GFAP+ cells (D) in the indicated region of SNpc. Data are shown as mean ± SEM. #P < 0.05, ##P < 0.01 vs. sham, *P < 0.05, **P < 0.01 vs. vehicle using one-way ANOVA with post hoc LSD t-test, n=4-6.

