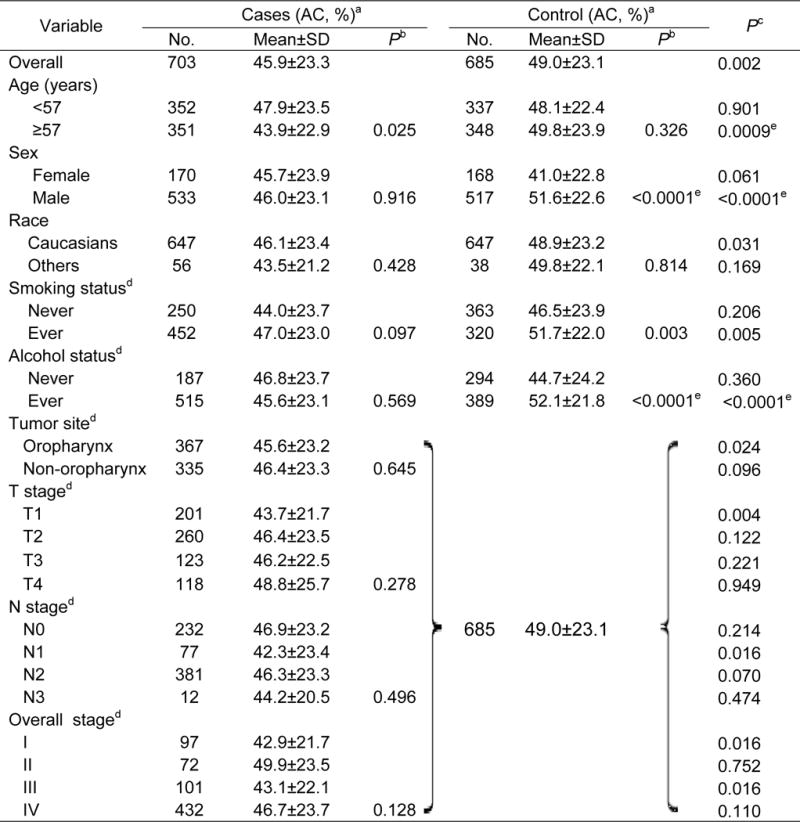
Table 2.
Apoptotic capacity (AC, %) between squamous cell carcinoma of the head and neck (SCCHN) patients and healthy control subjects in a North American population.

|
AC= [100 × (experimental apoptosis − spontaneous apoptosis)/(100 − spontaneous apoptosis)].
P values for the differences between subgroups were determined by the Student t test.
P values for the difference between cases and controls.
Missed 1 patients’ and 2 controls’ information.
Tests that could pass the Bonferroni threshold (0.05/38 tests =0.0013) for multiple testing correction.
