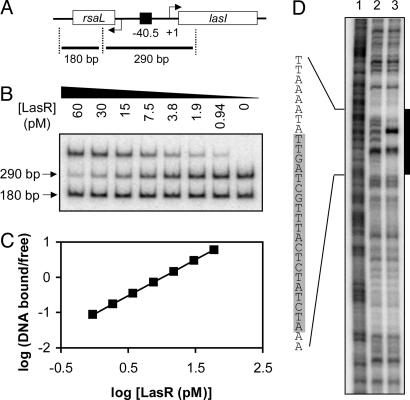
Fig. 1.
Binding of LasR to the rsaL–lasI intergenic region. (A) Map of the rsaL–lasI intergenic region. The black square indicates the las–rhl box sequence centered 40.5 bp upstream of the transcriptional start of the lasI gene. Specific and nonspecific fragments (290 and 180 bp in length, respectively) are shown. (B) Gel shift assay. All lanes contained ≈0.01 fmol of an equimolar mixture of the two probes and the indicated concentration of LuxR in the presence of 5 μM 3OC12-HSL. (C) Hill plot of the data obtained in A.(D) DNase I protection assay. The 290-bp specific fragment, end-labeled on the rsaL coding strand, was incubated without LasR (lane 2) or with LasR (lane 3) in the presence of 5 μM 3OC12-HSL. Lane 1 shows a Maxam–Gilbert A+G sequencing ladder of the probe. The black bar indicates the approximate region protected by LasR; the shaded area within the protected sequence indicates the predicted 20-bp las–rhl box.

