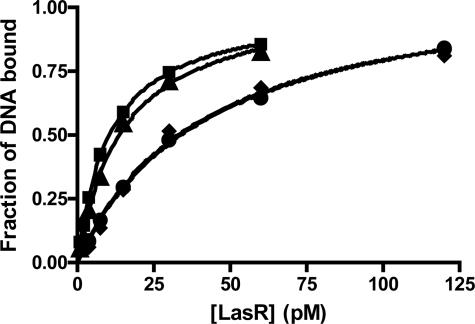
Fig. 3.
Binding of various LasR preparations to the rsaL-lasI intergenic region in the presence and in the absence of 3OC12-HSL. Results from gel-shift assays (as described in Fig. 1) were quantified by plotting the fraction of shifted specific DNA versus LasR concentration. Circles, LasR diluted in the absence of 3OC12-HSL; diamonds, dialyzed LasR in the absence of 3OC12-HSL; triangles, dialyzed LasR in the presence of 5 μM 3OC12-HSL; squares, LasR before dialysis in the presence of 5 μM 3OC12-HSL.

