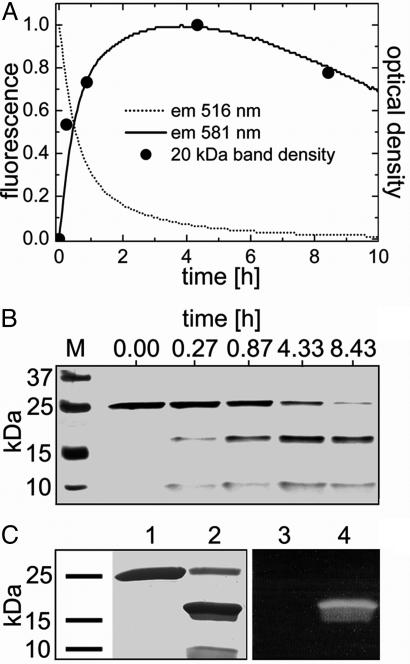
Fig. 4.
Time dependence of green-to-red photoconversion monitored by a combination of SDS/PAGE and fluorescence. (A) Fluorescence from green (dotted line) and red (solid line) species. •, Densities of the 20-kDa band in B. (B) SDS gel of marker bands (lane M) and EosFP protein after irradiation for a certain time, showing the correlation between the appearance of the 20- and 8-kDa bands and the red fluorescence. (C) Ponceau staining of the green (lane 1) and red (lane 2) form of EosFP after SDS/PAGE separation and transfer to a nitrocellulose membrane. With 366-nm excitation, red fluorescence is observed for the 20-kDa band (lane 4) but not for the 25-kDa band (lane 3).

