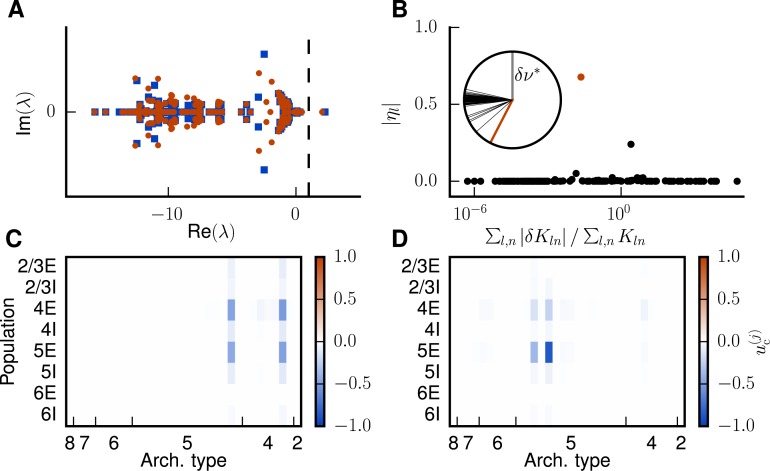
Fig 5. Eigenspectrum analysis of network stability.
A Eigenvalue spectrum of the effective connectivity matrix for the first (blue squares) and second (red dots) iteration. The dashed vertical line marks the edge of stability at a real part of 1. B Contribution (Eq (13)) of an individual eigenprojection to the shift of the unstable fixed point versus the relative change in indegrees associated with for the first iteration. The data point corresponding to is marked in red. The inset shows the relative angles between and the eigenvectors . The red line corresponds to the critical eigendirection. C Entries of the eigenvector associated with in the populations of the model. The affected areas are 46 and FEF. D Same as C for the second iteration.

