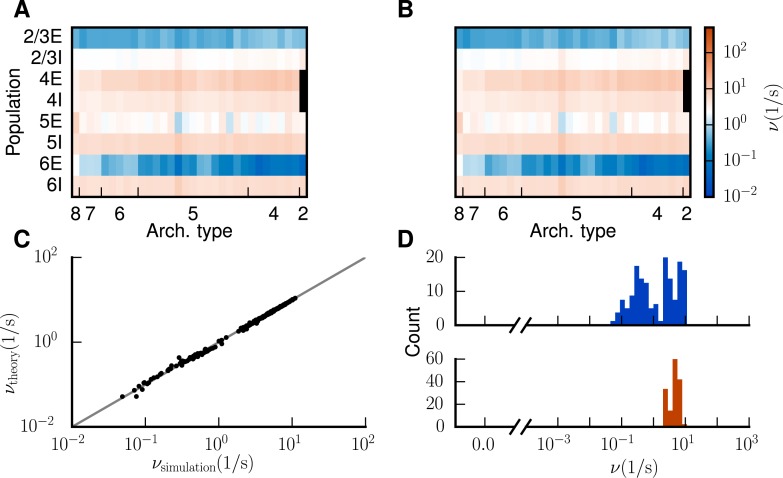
Fig 9. Improved low-activity fixed point of the model.
Population-averaged firing rates for encoded in color (A) predicted by the analytical theory and (B) obtained from the full simulation of the spiking network. Same display as in Fig 3. C Analytical versus simulated firing rates (black dots) and identity line (gray). D Histogram of population-averaged simulated firing rates. Same display as in Fig 3.

