Figure 3.
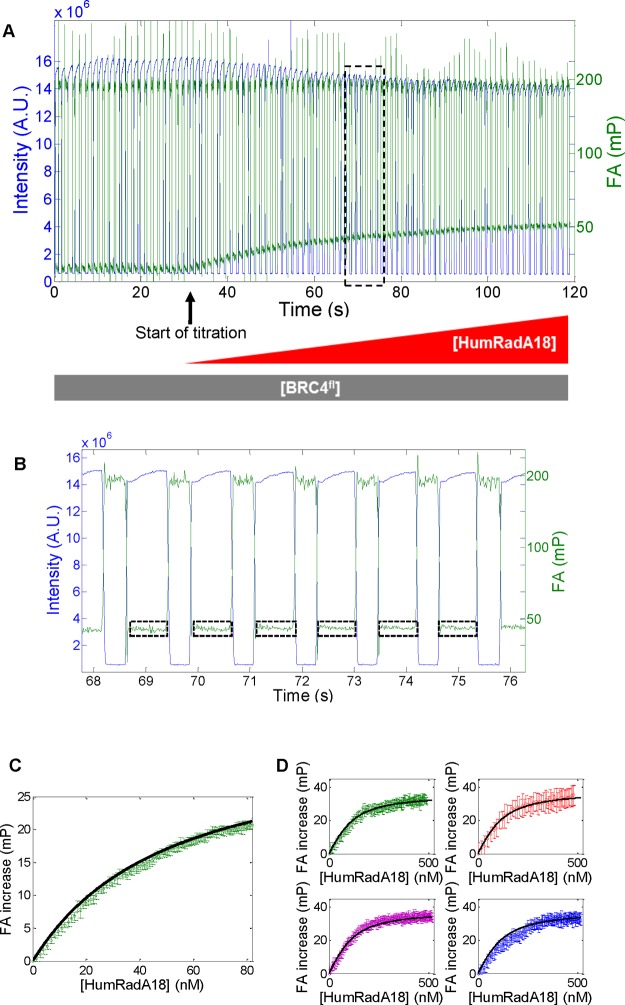
Addition of HumRadA leads to increased anisotropy. (A) Frame-by-frame data extraction of both total intensity (blue) and mean anisotropy (green) for a chosen ROI (as depicted in Figure 2A). The experiment is conducted with increasing [HumRadA] and constant [BRC4fl]. (B) Anisotropy and intensity data corresponding to the dashed rectangle in (A). This trace corresponds to six individual droplets passing through the field of view. Periods of high brightness in the region of interest correspond to the presence of a droplet. The dashed regions in (B) indicate periods when the region of interest is filled by a droplet, during which it is typically possible to obtain 70 frames of image data once the data are trimmed to exclude frames where the region of interest is only partially filled by the droplet. The anisotropy of the droplet and the measurement uncertainty can be estimated as the mean and standard deviation of these 70 values. (C) Anisotropy values plotted as a function of theoretical concentration of protein in each droplet calculated from the time when the droplet picture was taken (frame number). Vertical error bars correspond to the standard deviation of the mean anisotropy for each droplet. The black trace is the best fit obtained using eq 3. (D) Four dose–response curves for HumRadA18 obtained in parallel with the four-channel device.

