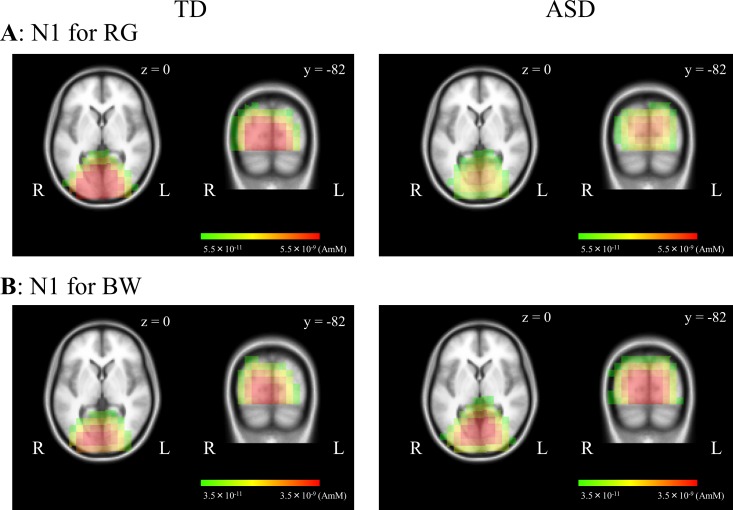
Fig 5. Source analysis for VEPs with RG and BW stimuli in each group.
sLORETA activities were mapped onto the MNI space. N1 components for RG (A) and BW (B) stimuli were located at around occipital areas including V1 in both groups. sLORETA, standardized low resolution brain electromagnetic tomography; MNI, Montreal Neurological Institute.

