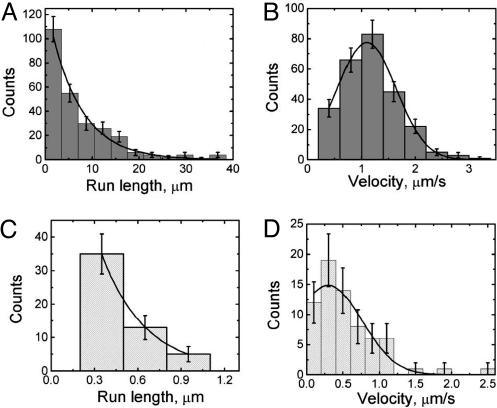
Fig. 2.
Parameters of capsid motion during entry. Histograms of the processivities and velocities of retrograde motion during entry are shown in A and B. A similar analysis of the minor anterograde component is shown in C and D. The distribution of minus-end run lengths (A) is reasonably modeled by a single decaying exponential functional form with a decay length of 6.7 ± 0.6 μm (χ2 = 1.09; df = 5). Note that there could be a short (undetected) population of runs, as our spatial and temporal resolution does not permit us to accurately resolve short runs (less than ≈400 nm in length). The distribution of minus-end velocities, calculated by dividing the spatial run length by its temporal duration (B), is well modeled by a Gaussian functional form centered at 1.10 ± 0.03 μm/s and a width of 1.1 ± 0.05 μm/s (χ2 = 0.52; df = 3). The distribution of plus-end runs (C) seems reasonably described by a single decaying exponential functional form with a decay length of ≈0.3 μm, but this result should be viewed as an estimate only, because many of the short runs are likely below the limit of our current resolution (a meaningful χ2 value could not be determined due to these limitations). Similarly, our data suggest that the distribution of plus-end velocities (D) is reasonably modeled by a Gaussian functional form centered at 0.30 ± 0.16 μm/s and a width of 0.92 ± 0.28 μm/s. Error bars are expected uncertainty, assuming Gaussian statistics for all graphs.

