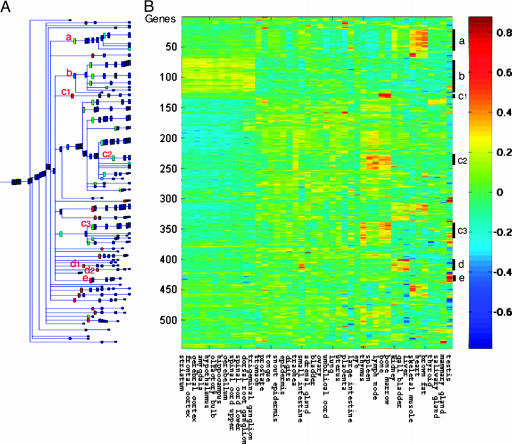
Fig. 1.
M1-t-p53 myeloid leukemic cells initially express genes that are preferentially expressed in different normal tissues. Highly expressed genes in the leukemic cells, which were differentially expressed in normal mouse tissues, were clustered according to their relative expression in normal mouse tissues by using SPC as described in Materials and Methods.(A) Dendrogram of the 547 differentially expressed genes that include clusters of at least five genes. Selected clusters showing genes with similar relative expression in different normal tissues are marked by the red letters a–e. (B) Reordered expression matrix according to the clustering result, where each row represents a gene and each column represents a tissue. The clustering operation imposes a linear ordering of the data points, and the rows and columns were ordered accordingly. The colors indicate the relative expression levels of the genes in 45 normal tissues according to the color code shown at the right. The bars and letters at the right represent the selected gene clusters a–e.

