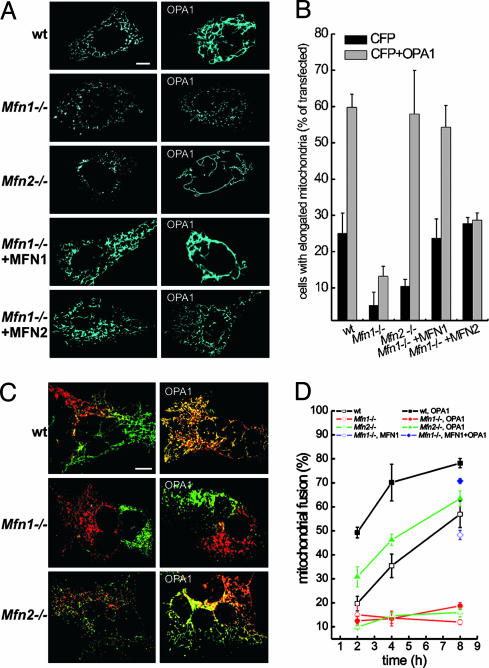
Fig. 3.
OPA1 changes the shape of the mitochondrial reticulum by promoting MFN1-dependent mitochondrial fusion. (A) Effect of OPA1 on the shape of the mitochondrial network in WT, Mfn1–/–, and Mfn2–/– MEFs. MEFs of the indicated genotype grown on coverslips were cotransfected with mtCFP and empty vector (Left) or OPA1 (Right). When indicated, MFN1 or MFN2 were cotransfected with mtCFP in Mfn1–/– MEFs. After 24 h, images of mtCFP fluorescence were acquired exactly as in Fig. 1 A–H.(B) Morphometric analysis of WT, Mfn1–/–, and Mfn2–/– mitochondria. MEFs of the indicated genotype grown on coverslips were cotransfected with mtCFP and empty vectors (black bars) or with OPA1 (gray bars). Where indicated, Mfn1–/– cells were complemented by cotransfection with MFN1 or MFN2. Experiments were performed exactly as in Fig. 1I. Data represent mean ± SE of nine different experiments. (C) MEFs of the indicated genotype were transfected with mtYFP or mtRFP (Left) or cotransfected with mtYFP or mtRFP plus OPA1 (Right), coplated on glass coverslips, fused with PEG as described in Experimental Procedures, and fixed after 4 h. Confocal images of representative polykaryons are shown. (Scale bar, 20 μm.) (D) Quantification of the effect of OPA1 on fusion of WT, Mfn1–/–, and Mfn2–/– mitochondria. The experiments were conducted as described in C, except that heteropolykaryons were fixed at the indicated times. In the experiments depicted with diamonds, Mfn1–/– cells were cotransfected with mtYFP or mtRFP plus MFN1 (⋄) and with mtYFP or mtRFP plus MFN1 and OPA1 (♦). Mitochondrial fusion was evaluated as described in Experimental Procedures from 30 randomly selected polykaryons. Data represent mean ± SE of four different experiments.

