
Fig. 1. Regional reference panel, PCA, and ADMIXTURE analysis.
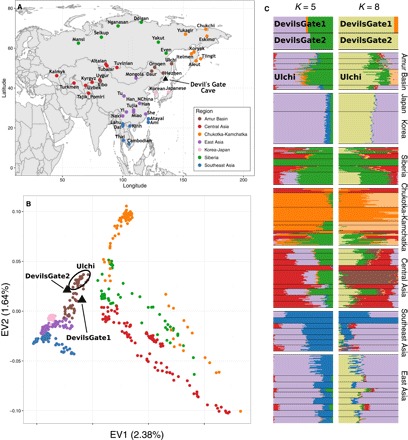
(A) Map of Asia showing the location of Devil’s Gate (black triangle) and of modern populations forming the regional panel of our analysis. (B) Plot of the first two principal components as defined by our regional panel of modern populations from East Asia and central Asia shown on (A), with the two samples from Devil’s Gate (black triangles) projected upon them (18). (C) ADMIXTURE analysis (19) performed on Devil’s Gate and our regional panel, for K = 5 (lowest cross-validation error) and K = 8 (appearance of Devil’s Gate–specific cluster).