
Fig. 2. Outgroup f3 statistics.
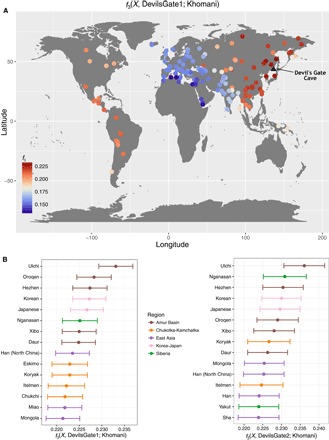
Outgroup f3 measuring shared drift between Devil’s Gate (black triangle shows sampling location) and modern populations with respect to an African outgroup (Khomani). (A) Map of the whole world. (B) Fifteen populations with the highest shared drift with Devil’s Gate, color-coded by regions as in Fig. 1. Error bars represent 1 SE.