
Fig. 3. Spatial pattern of outgroup f3 statistics.
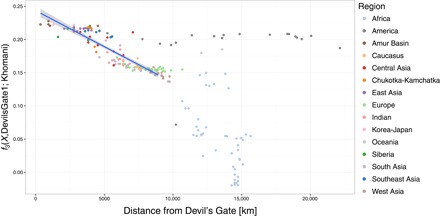
Relationship between outgroup f3(X, Devil’s Gate; Khomani) and distance on land from Devil’s Gate using DevilsGate1 and all single-nucleotide polymorphisms (SNPs). Populations up to 9000 km away from Devil’s Gate were considered when computing correlation. The highest distance considered was chosen to acquire the highest Pearson correlation in steps of 500 km. Best linear fit (r2 = 0.772, F1,108 = 368.4, P < 0.001) is shown as blue line, with 95% CI indicated by the shaded area.