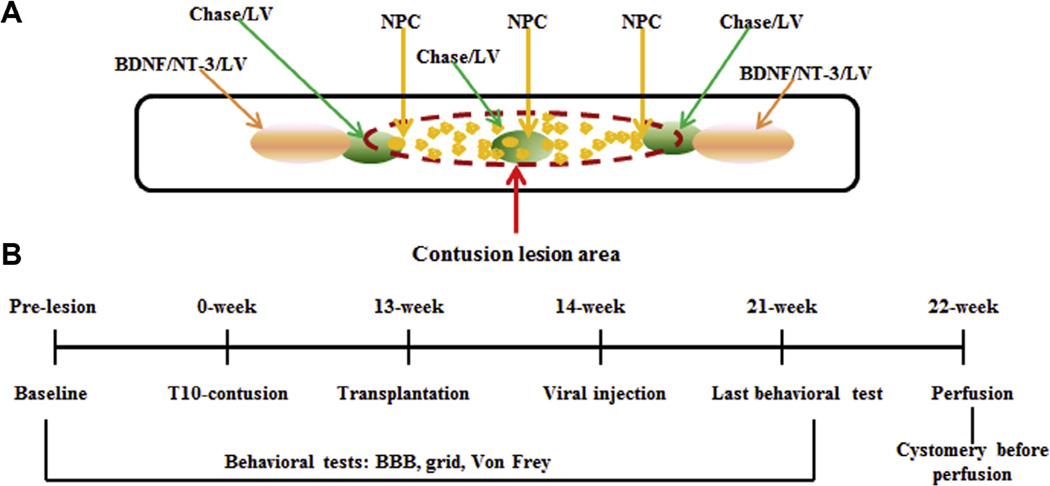
Fig. 1.
Outline of experimental design, time line, and groups. Panel A shows the location of transplanted NPCs and viral injection. Panel B shows the time line. Four experimental groups were used in this study: Medium (Control, n = 9); NPC (n = 10); N/C (NPC + Chase/LV, n = 10); N/C/G (NPC + Chase/LV + BDNF/NT-3/LV, n = 8).

