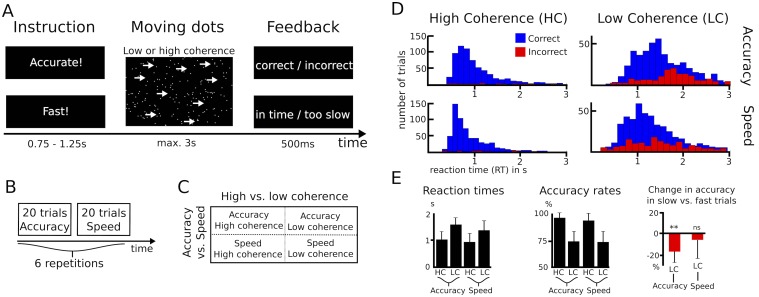
Figure 1. Paradigm and behavioral data.
(A–C) Overview of experimental task and the 2*2 study design. (D) Histograms of RT distributions for correct (blue) and error (red) trials for all four conditions. (E) Second level comparison of reaction times (left), accuracy rates (middle) and change in accuracy rates in slow vs. fast trials (right). HC, high coherence; LC, low coherence; ** significant at p<0.01; ns, not significant. Error bars indicate standard deviation.
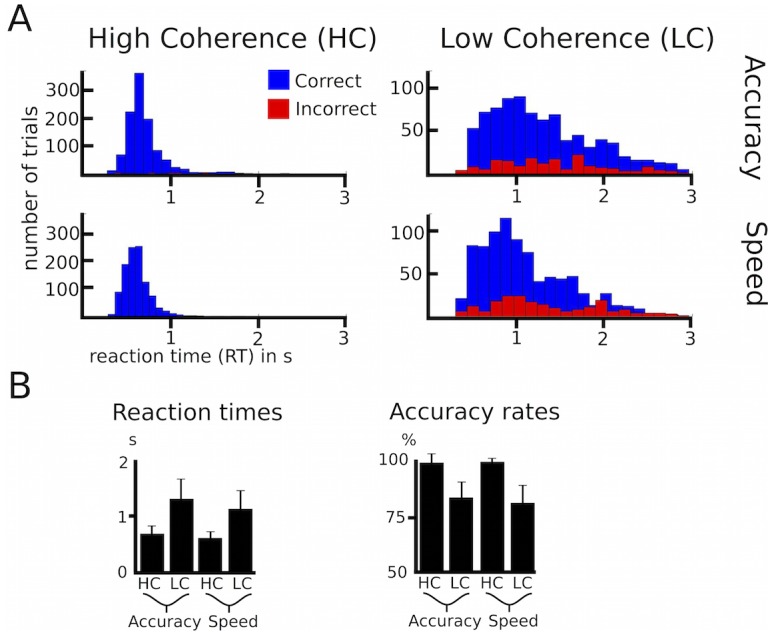
Figure 1—figure supplement 1. Behavioral data of healthy participants.


