. 2017 Jan 31;6:e21481. doi: 10.7554/eLife.21481

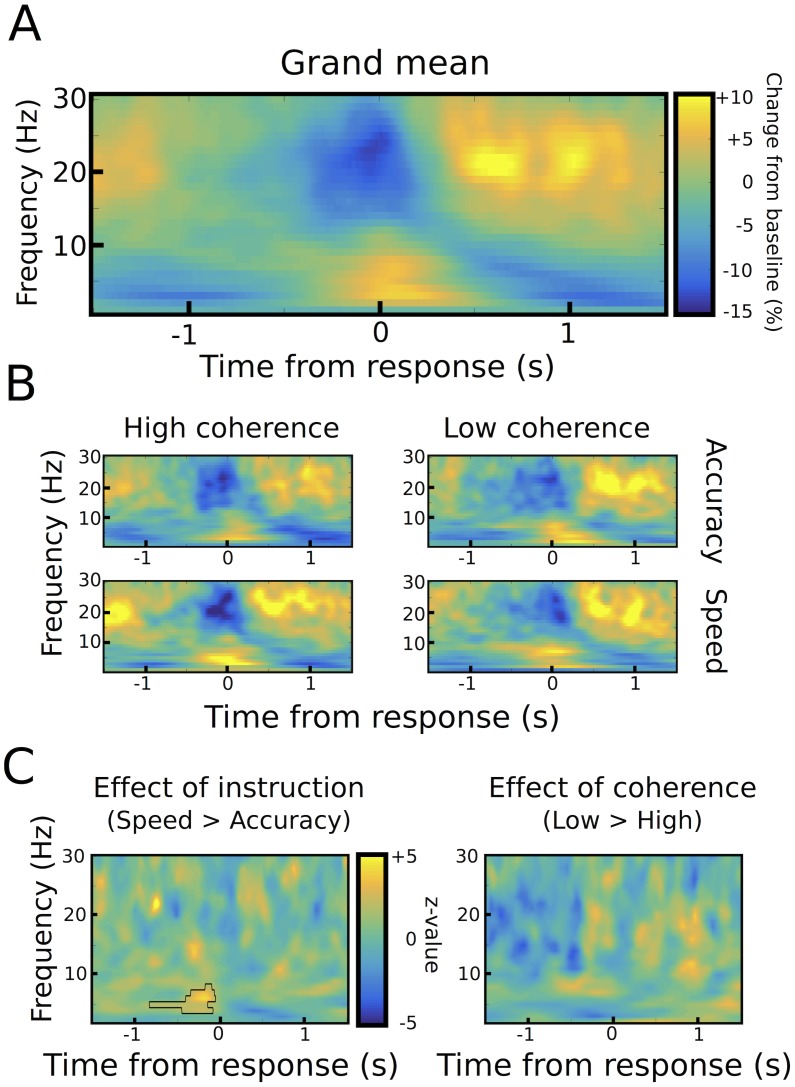
Figure 3. Response-aligned STN power changes.

(A) Time frequency spectrum aligned to the onset of the motor response from −1.5 to +1.5 s averaged across conditions. (B) Spectra shown separately for the four conditions. The color map is identical to A. (C) Significant differences between conditions as revealed by cluster-based permutation tests.

DOI: http://dx.doi.org/10.7554/eLife.21481.007

Figure 3.

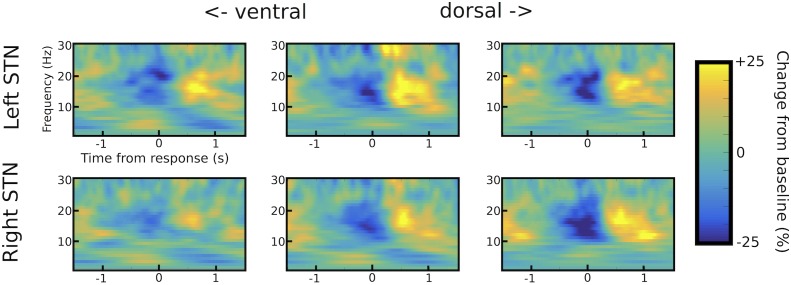
Figure 3—figure supplement 1. STN channel selection.

Figure 3—figure supplement 1.

Example of channel selection for one representative patient (patient #6). Response-aligned time frequency spectra are shown for the three bipolar channels (from left to right: ventral -> middle -> dorsal) for both STNs (left STN in upper row, right STN in lower row). The channel with the strongest LFO increase was picked if (i) it was not further than two contacts away from the channel with the strongest beta modulation (only relevant for omnidirectional octopolar electrodes) and (ii) also showed a pronounced beta modulation. In this patient, the most ventral contact was chosen for left STN and the middle contact for right STN. Note that the most ventral contact of right STN also showed LFO modulation, but only very little beta modulation. Therefore, the middle contact was chosen for the right STN.
Figure 3—figure supplement 2. Differences in STN power between correct and incorrect trials.
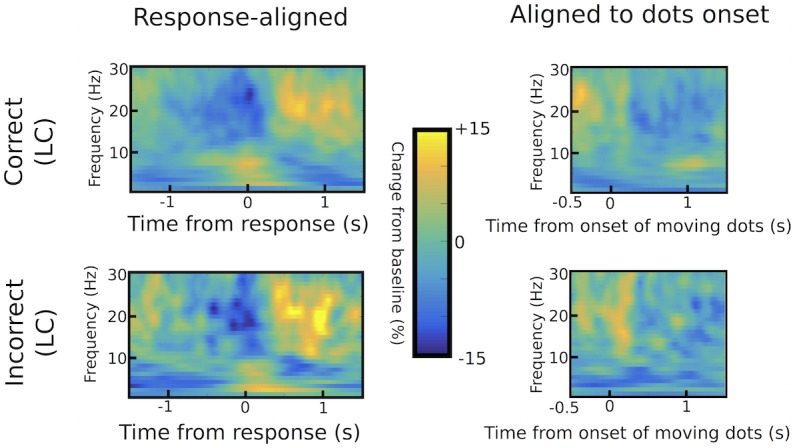
Figure 3—figure supplement 2.

Response-aligned time frequency spectra are shown in the left column, while spectra aligned to the onset of the moving dots are shown in the right column for correct (upper row) and incorrect (lower row) low coherence trials. There were no statistically significant differences between correct and incorrect responses using permutation testing (1000 permutations with p=0.05 as cluster-building and statistical threshold for cluster-based comparisons).