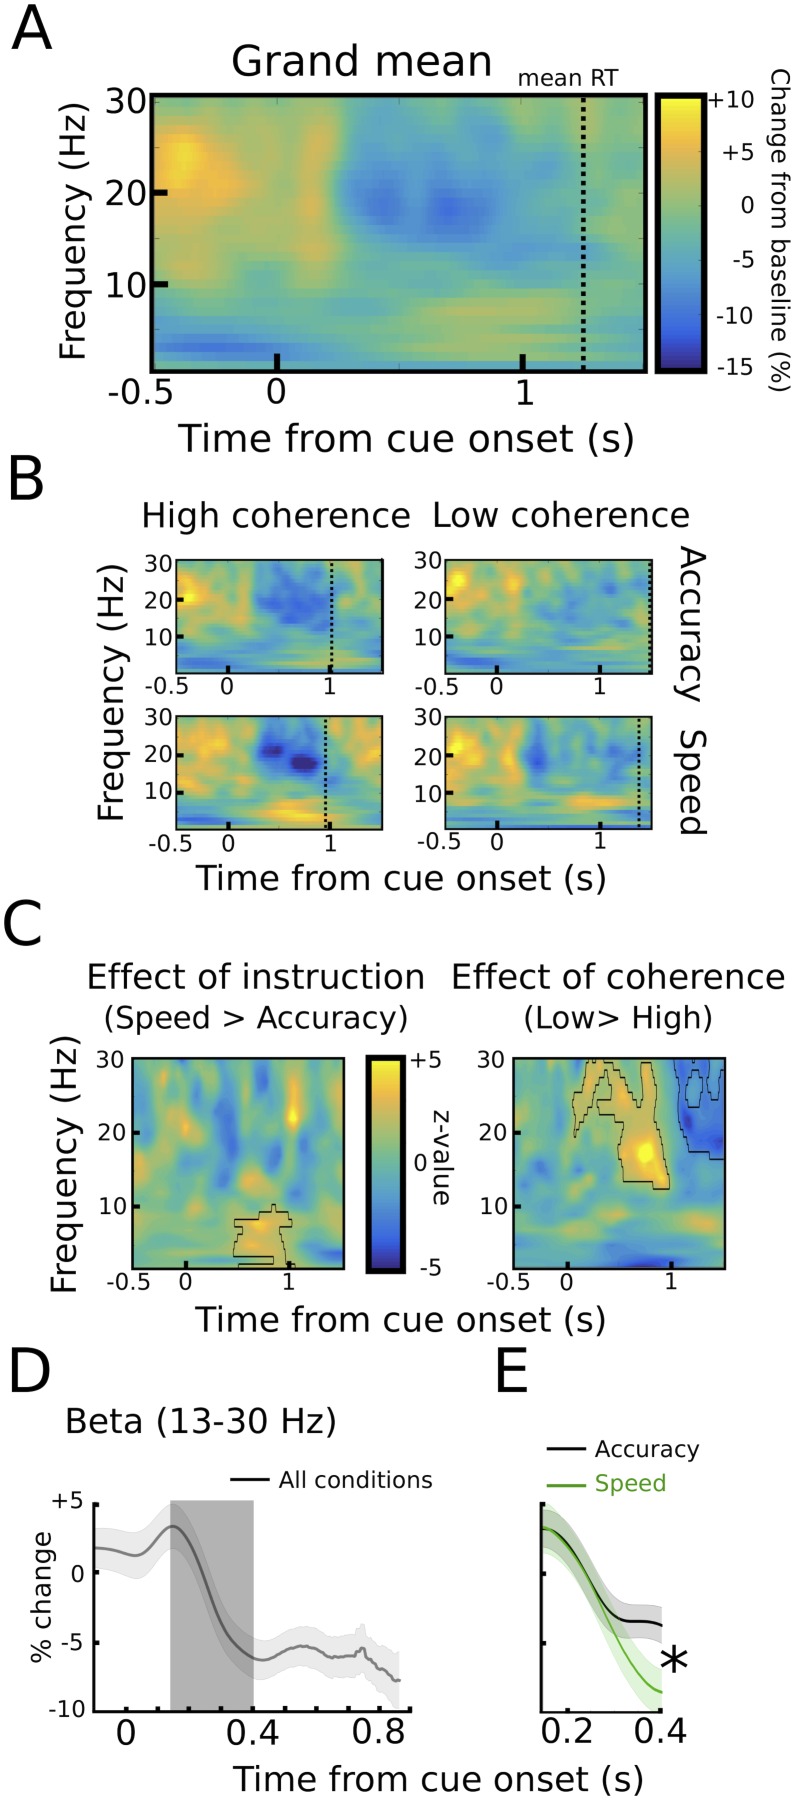
Figure 4. STN power changes aligned to the onset of the moving dots.
(A) Time frequency spectrum aligned to the onset of the cue from −0.5 to +1.5 s averaged across conditions. (B) Spectra shown separately for the four conditions. The color map is identical to A. (C) Significant differences between conditions as revealed by cluster-based permutation tests. (D) Cue-induced decrease in beta power (13–30 Hz) averaged across conditions. The time series of each trial was capped at the time of the response before averaging. A decrease in beta power was evident from ~150 ms to 400 ms after the onset of the moving dots. (E) This beta decrease was stronger in speed vs. accuracy instructions (but not high vs. low coherence). For D and E and solid traces represent mean, while shaded areas around the traces indicate standard error of the mean. *, significant at p<0.05.

