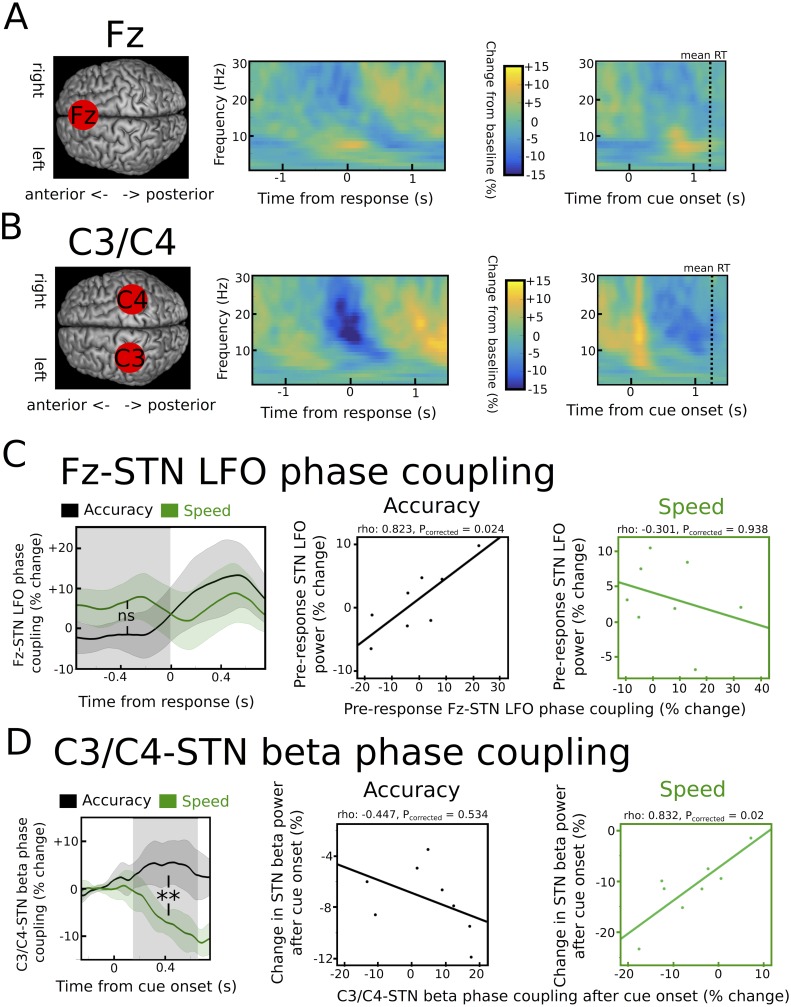
Figure 6. Task-related changes in cortical activity and cortico-STN connectivity.
(A) Time frequency spectrum for EEG at electrode Fz aligned to the motor response (from −1.5 to +1.5 s) and cue-onset (from −0.5 to 1.5 s) averaged across conditions. The pre-response increase in LFO was significantly stronger at Fz compared to electrode C3/C4 (p<0.05). (B) Time frequency spectrum for EEG at electrode C3/C4 aligned to the motor response (from −1.5 to +1.5 s) and cue-onset (from −0.5 to 1.5 s) averaged across conditions. The cue-induced beta decrease was significantly stronger at C3/C4 compared to Fz (p<0.001). (C) Inter-site phase clustering (ISPC) between LFO at Fz and STN. The left column shows ISPC separately for speed (green) and accuracy instructions (black). In C and D, the shaded rectangles indicate the time windows of interest, which were based on the analysis of STN power changes. Solid traces represent mean and shaded areas around the traces indicate standard error of the mean. The middle and right columns show correlation analyses between Fz-STN LFO ISPC and STN LFO power changes for accuracy and speed instructions, respectively. Each observation corresponds to one patient (n = 8). (D) Same as C, but for C3/C4-STN ISPC in the beta band. **, significant at p<0.01; ns, not significant.

