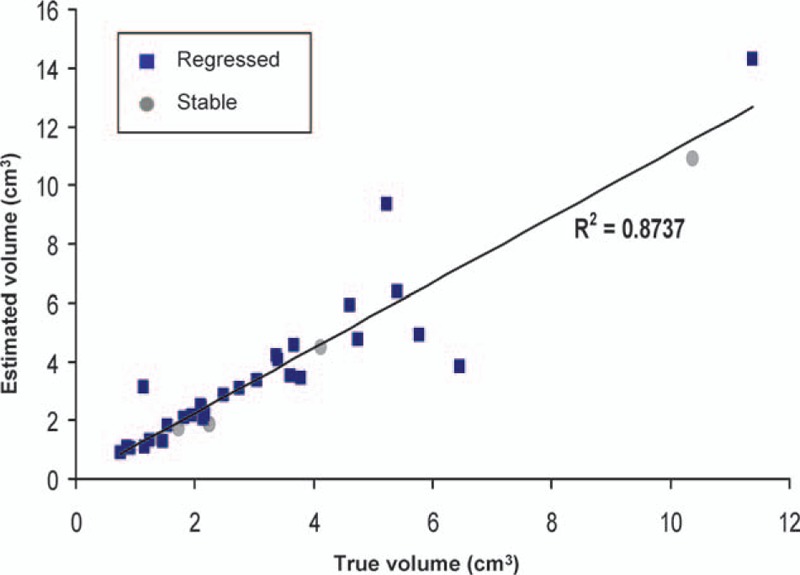
Figure 11.

Linear regression demonstrating a higher correlation between the estimated volume using the exponential fitting formula and the measured volume through magnetic resonance imaging at the 10th month in the regressed plus stabilized group after excluding those that progressed (R2 = 0.87; Pearson correlation coefficient = 0.93), suggesting a better feasibility in the application of the exponential model.
