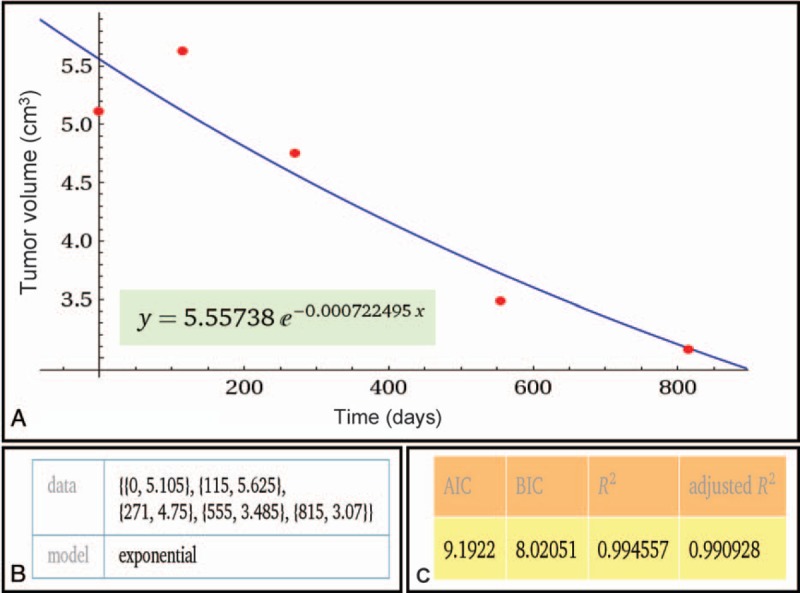
Figure 2.

(A) Representative exponential fitting curve of a pituitary adenoma with eventual regression. The fitting formula is listed below. Wolfram Alpha LLC; 2015. Available at: http://www.wolframalpha.com/input/?i=exponential+fit+%7B0%2C+5.105%7D%2C+%7B115%2C+5.625%7D%2C+%7B271%2C+4.75%7D%2C+%7B555%2C+3.485%7D%2C+%7B815%2C+3.07%7D (accessed November 20, 2015). (B) The input data of the fitting model: {x, y} = {Days after SRS, volume}. (C) Parameters testing the relative goodness-of-fit demonstrating a good fit.
