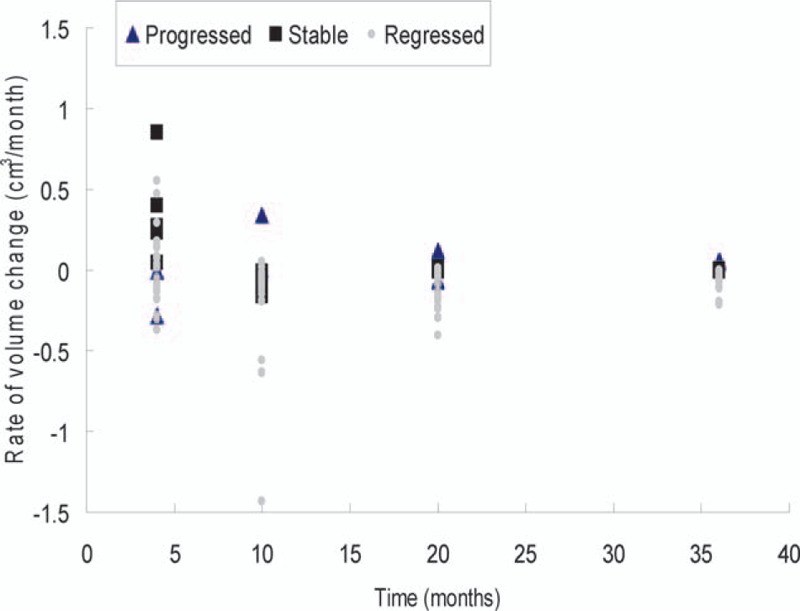
Figure 5.

Scatter plot demonstrating the rate of volume change (cm3/mo) of the whole follow-up course separated by different outcome groups. There was increased variability in rate in the first 4 months, with stabilization after 10 months. All tumors gained a stable rate in the 36th month (mean −0.05 cm3/mo, P = 0.001).
