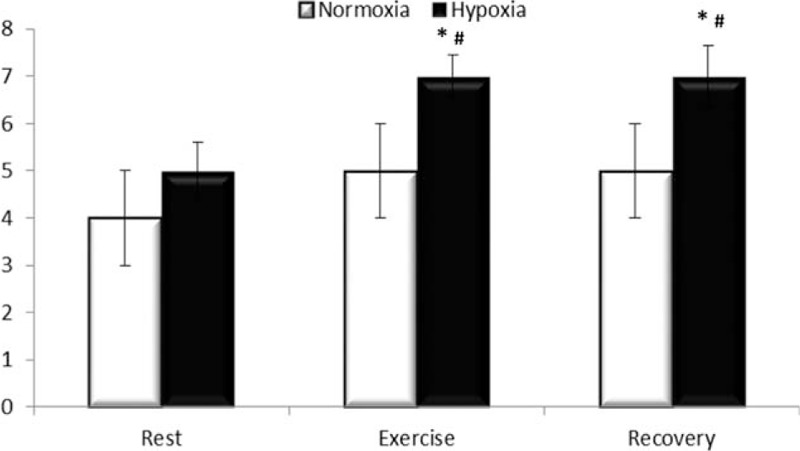
Figure 2.

Endotoxin concentration. Results are expressed in EU/mL in normoxic condition (white bars) and hypoxia (black bar) at rest (Rest), immediately after exercise (Exercise) and 1 h after exercise (Recovery). Results are expressed in media ± standard deviation for 9 voluntaries. ∗ Different compared with normoxia, # different compared with rest, P <0.05.
