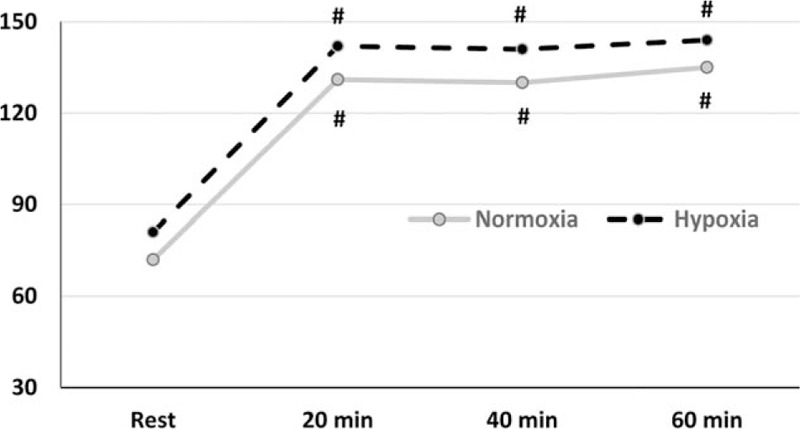
Figure 3.

Heart rate. Results are expressed in beat per minute (BPM) in normoxic condition (gray line) and hypoxia (black line) at rest (Rest), 20, 40, and 60 min during exercise. Results are expressed in media for 9 voluntaries. # Different in relation to rest, P <0.05.
