
Figure 3.
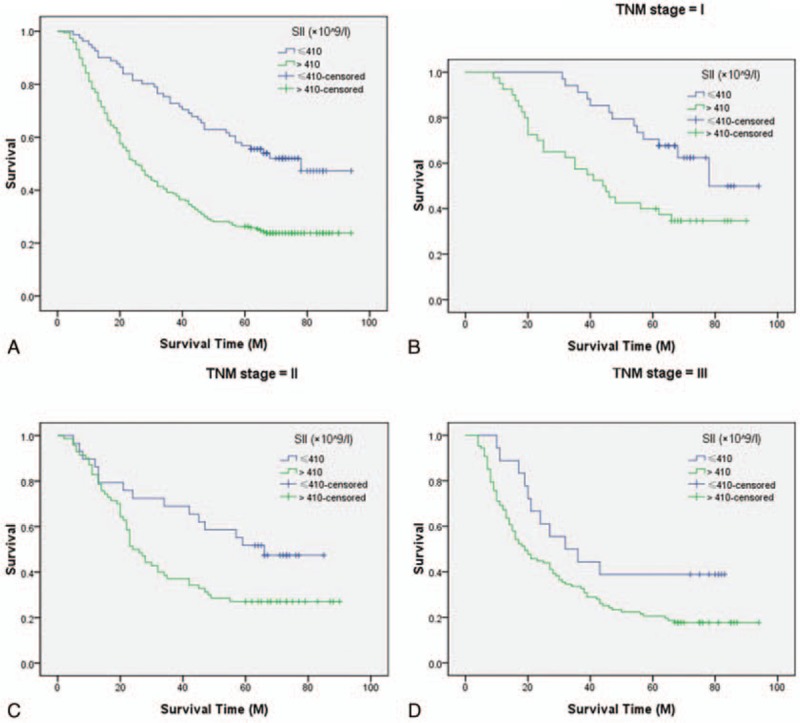
Kaplan–Meier CSS curves stratified by SII. Patients with SII ≤ 410 (×109/L) had a significantly better 5-year CSS than patients with SII > 410 (×109/L) (51.9% vs 24.0%, P < 0.001; A). The predictive value of SII was significant in patients based on the TNM stage (I stage: 61.8% vs 35.0%, P = 0.005; B), (II stage: 48.3% vs 27.1%, P = 0.028; C), and (III stage: 38.9% vs 17.8%, P = 0.045; D). CSS = cancer-specific survival, SII = immune-inflammation index, TNM = tumor node metastasis.