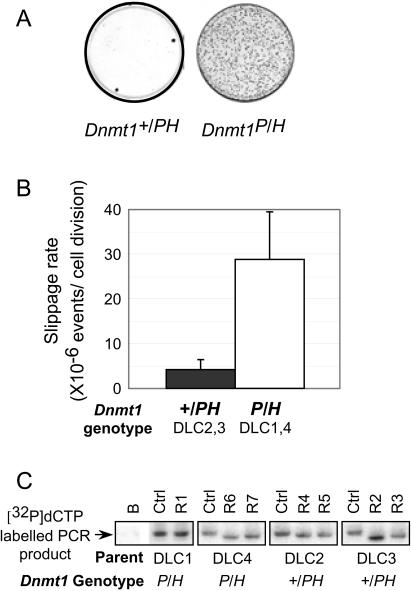
Figure 4.
Fluctuation analysis of Dnmt1 mutant cells. (A) Initial in-frame mutants were counterselected against the TK gene with 6 μM FIAU. G418 reversion mutants that arose during the course of the expansion phase were selected G418. Representative methylene blue stainings of Dnmt1+/PH and Dnmt1P/H culture plates after G418 selection are shown. (B) The slippage rates were in the Dnmt1 mutant cell lines calculated using the method of means equation. For the pair of single-copy TKNeo25A clones, the average rates were calculated from six independent fluctuation analyses representing a total of 72 independent parallel cultures. The bars represent the mean value obtained for these fluctuation analyses. Error bars indicate the SEM. (C) Slippage of the 25A mononucleotide was verified by PCR. Representative PCR analyses of seven G418 resistant clones with primers detecting microsatellite instability are shown. A pair of PCR primers (indicated as arrows in Figure 1) spanning the microsatellite in the 5′ end of the TK amplifies a 204 bp fragment with radiolabelled [α-32P]-dCTP. Controls are from cells that underwent the Luria–Delbrück expansion phase before G418 selection; R1–7 are from G418 reversion mutant cells after Luria–Delbrück selection phase; B are no DNA control.

