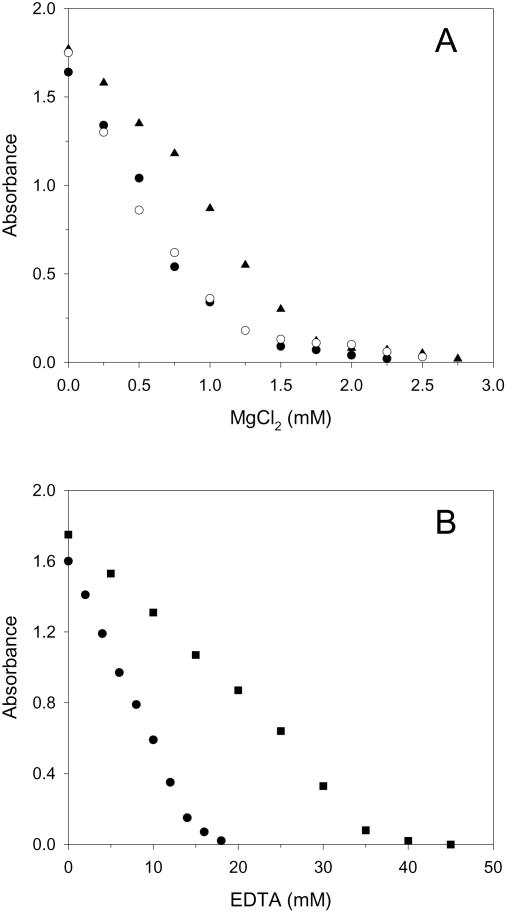
Figure 2.
Turbidity of wt Dps solutions as a function of MgCl2 (A) and EDTA (B) concentration. Turbidity, expressed in arbitrary units, was measured at 400 nm. Conditions: protein concentration 1 μM. In (A), purified Dps (open circles) and Chelex-treated Dps in 10 mM Tris–HCl, 20 mM NaCl, pH 7.0 (black circles); Chelex-treated Dps in the same buffer containing 0.4 mM EDTA (black triangles). In (B), Chelex-treated Dps in 10 mM Tris–HCl, 20 mM NaCl at pH 7.0 (black squares) and pH 7.8 (black circles).

